- Table of Content
- 1.X1.9 flare
- 2.Prominence eru...
- 3.Review of Sola...
- 4.International ...
- 5.PROBA2 Observa...
- 6.Noticeable Sol...
- 7.Geomagnetic Ob...
- 8.Review of Iono...
- 9.The SIDC Space...
- 10.Upcoming Activ...
2. Prominence eruptions through the eyes of ASPIICS
3. Review of Solar and Geomagnetic Activity
4. International Sunspot Number by SILSO
5. PROBA2 Observations
6. Noticeable Solar Events
7. Geomagnetic Observations in Belgium
8. Review of Ionospheric Activity
9. The SIDC Space Weather Briefing
10. Upcoming Activities
X1.9 flare
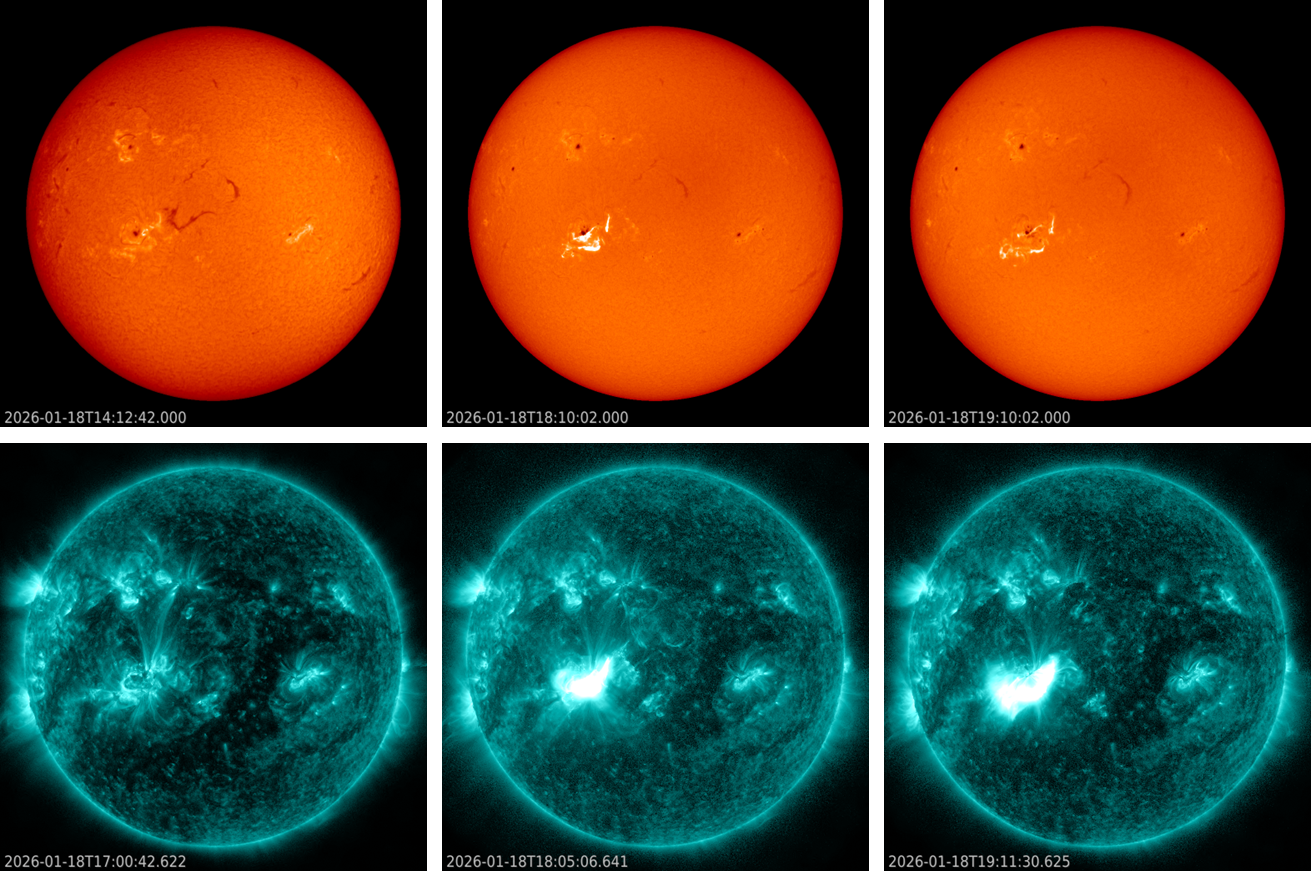
SIDC sunspot group 740 https://www.sidc.be/services/event-chains/sunspots (NOAA 4341) is the largest and most complex active region currently on the solar disk. It was showing some signs of decay (smaller sunspot area, no more delta structures,...) when all of a sudden it produced a major long-duration event on 18 January. This X-class flare started at 17:27 UTC, peaked at 18:09 UTC (X1.9), and ended at 18:51 UTC. The main reason for the eruption was the growing unstability of the surrounding filaments. Solar filaments are clouds of charged particles ("plasma") above the solar surface squeezed between magnetic regions of opposite polarity. Being cooler and denser than the plasma underneath and their surroundings, they appear as dark lines when seen on the solar disk. Special filters are required to observe these features, and one such a filter is the Hydrogen-alpha (H-alpha) line in the red part of the solar spectrum. The unstable filaments in NOAA 4341 eventually resulted in a stunning eruption both in H-alpha (GONG) as well as in extreme ultraviolet (EUV ; SDO/AIA 131). The imagery underneath shows the eruption in H-alpha (upper row) and in EUV (lower row) at the beginning, peak and ending of the flare. Clips are available in the online version of this article at https://www.stce.be/news/800/welcome.html Note how, in the H-alpha clip, the filaments south and to the west of NOAA 4341 have disappeared after the flare. The "smudges" are due to passing clouds.
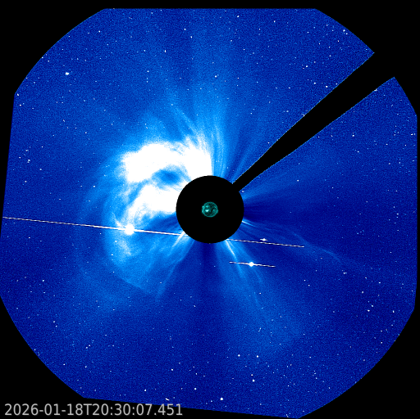
Associated with this eruption was a fast full halo coronal mass ejection (CME). The preliminary speed of this wide CME is estimated to be 1500-1800 km/s based on STEREO-A coronagraphic observations. Though the bulk of the CME seems to be directed behind (trailing) the Earth, there's still a strong earth-directed component thought to start affecting the earth environment during the first half of 20 January. Moderate to severe geomagnetic conditions (Kp 6 to 8) are possible. This means that there's a small chance on aurora over Belgium if the high Kp values materialize during the nighttime. Standing-by for the SIDC space weather forecaster analysis for a more finetuned prediction. Solar Orbiter is currently almost between the Sun and the Earth, and so its MAG instrument, which measures the magnetic field of the solar wind (Imperial College London), may provide an early warning of the interplanetary CME as it is heading towards Earth. Underneath are images by the SOHO/LASCO C3 coronagraph of the halo CME, overlaid on SDO/AIA solar images in EUV. The 3 bright dots near the Sun and the occulting disk are planets, resp. (from left to right) Venus, Mercury and Mars. They are all located on the other side of the Sun as seen from Earth, a so-called "superior conjunction".
The eruption was also associated with a strong proton event (protons with energies exceeding 10 MeV), passing the alert threshold on 18 January at 22:55 UTC (GOES). The maximum peak reached so far was 1990 pfu (proton flux units) at 13:25 UTC, making it the strongest proton event so far this solar cycle. However, because the flux of the more energetic protons (energies of several 100 MeV) remained mostly at background levels, no Ground Level Enhancement (i.e. increase in natural radiation at the surface of the Earth) was observed. Hence, the radiation hazard for astronauts and for passengers/crew on polar flights remained low.
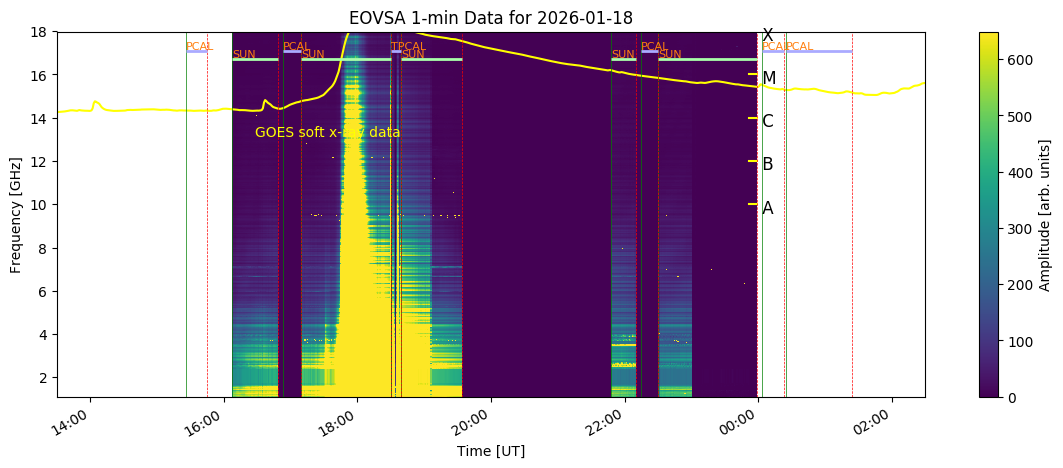
The flare was also associated with radio noise on all frequencies observed, as shown in the EOVSA graph underneath (https://www.ovsa.njit.edu/status.php# ). NOAA/USAF stations reported enhancements of several thousands of solar flux units (sfu) at all observed frequencies, with the least enhancement at GNSS frequencies (1415 MHz). Thus, satellite communications were most likely little to not affected by this solar radio burst. The Penticton values for the 10.7 cm radio flux, used e.g. as an input for satellite drag calculations, were all 3 affected (much higher than normal).
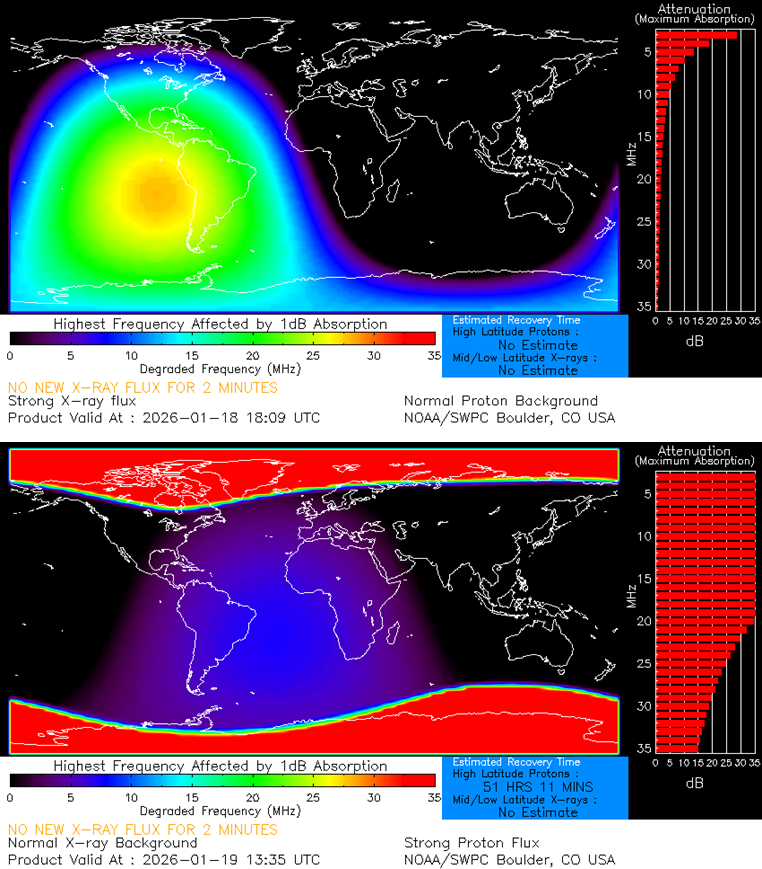
The x-ray and EUV radiation from the X1 flare affected the ionosphere on the dayside of the Earth, affecting the lower portion of the High Frequency radio communication (HF Com ; 3-30 MHz). Also the high proton flux is currently affecting HF Com, but this time almost over the entire HF range and only over the polar regions, a so-called Polar Cap Absorption (PCA). There's a chance that the PCA lasts until 20 and possibly even 21 January, and that HF radio communication over the polar caps is not possible during that timeframe. The D-RAP maps (NOAA ; https://www.swpc.noaa.gov/products/d-region-absorption-predictions-d-rap ) underneath show the impact of the flare (top) and proton event (bottom) on the HF Com, both location and intensity ("attenuation").
Prominence eruptions through the eyes of ASPIICS
The marvelous animation below shows Proba-3/ASPIICS observing the Sun during an active period on 21 September 2025, with one image taken every five minutes, capturing three prominence eruptions in five hours.
"Seeing so many prominence eruptions in such a short timeframe is rare, so I'm very happy we managed to capture them so clearly during our observation window," says Andrei Zhukov, Principal Investigator for ASPIICS.
More details can be found on the ESA webpage: https://www.esa.int/ESA_Multimedia/Images/2026/01/Proba-3_our_eyes_on_the_Sun_s_inner_corona
Review of Solar and Geomagnetic Activity
WEEK 1307 from 2026 Jan 12
Solar Active Regions (ARs) and flares
Solar flaring activity was moderate to high during the week. A total of 25 C-class flares, 3 M-class flares and 1 X-class flare were observed. The largest flare was an X1.9 flare (SIDC Flare 6678), peaking on 2026 Jan 18 at 18:09 UTC, produced by SIDC Sunspot Group 740 (NOAA AR 4341). There were a total of 9 active regions observed on the visible solar disk over the week.
Coronal Mass Ejections
A full-halo coronal mass ejection (CME; angular width about 360 degrees) was detected in SOHO/LASCO C2 data on 2026 Jan 18 at 18:12 UTC, associated with the X1.9 flare, produced by SIDC Sunspot Group 740 (NOAA AR 4341). Given the source location and the association with the Type II Radio Burst emission, the CME is considered Earth-directed, with a plane-of-sky speed that was estimated at 1000 to 1500 km/s.
Coronal Holes
During the past week, a small polar negative polarity mid-latitude coronal hole (CH) crossed the central meridian on Jan 13.
A large positive polarity equatorial CH crossed the central meridian since Jan 16.
Proton flux levels
The greater than 10 MeV GOES proton flux was mainly below the 10 PFU threshold but raised above the 10 pfu threshold since 2026 Jan 18 at 22:50 UTC. This proton event is associated with the X.1.9 flare of Jan 18.
Electron fluxes at GEO
The greater than 2 MeV electron flux was mainly above the 1000 pfu threshold entire week, with by the end of the week some periods below the threshold.
Solar wind
During the entire week the solar wind at Earth was fast. Solar wind speed was at around 500 km/s in the beginning of the week and increased even further since Jan 15 to a maximum speed around 770 km/s, then gradually returned to 500 km/s by the end of the week. The maximum interplanetary magnetic field was up to 14 nT, with the Bz reaching a minimum value of -12 nT.
Geomagnetism
Geomagnetic conditions reached minor storm conditions (Kp=5) on Jan 17, and several periods of active conditions were identified over the week due to the influence of the high speed stream.
International Sunspot Number by SILSO
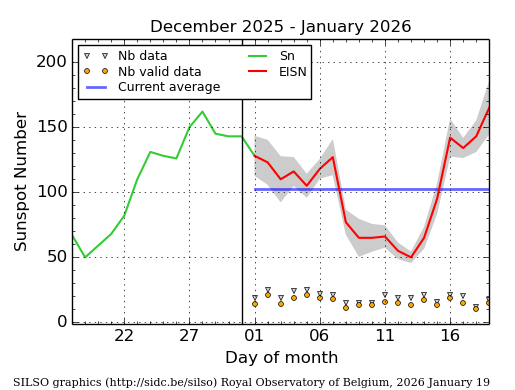
The daily Estimated International Sunspot Number (EISN, red curve with shaded error) derived by a simplified method from real-time data from the worldwide SILSO network. It extends the official Sunspot Number from the full processing of the preceding month (green line), a few days more than one solar rotation. The horizontal blue line shows the current monthly average. The yellow dots give the number of stations that provided valid data. Valid data are used to calculate the EISN. The triangle gives the number of stations providing data. When a triangle and a yellow dot coincide, it means that all the data is used to calculate the EISN of that day.
PROBA2 Observations
Solar Activity
Solar flare activity fluctuated from low to high during the week. In order to view the activity of this week in more detail, we suggest to go to the following website from which all the daily (normal and difference) movies can be accessed here: https://proba2.oma.be/ssa
This page also lists the recorded flaring events. A weekly overview movie can be found here (SWAP week 825): https://proba2.sidc.be/swap/data/mpg/movies/weekly_movies/weekly_movie_2026_01_12.mp4
Details about some of this week's events can be found further below. If any of the linked movies are unavailable they can be found in the P2SC movie repository here: https://proba2.oma.be/swap/data/mpg/movies/
Sunday Jan 18
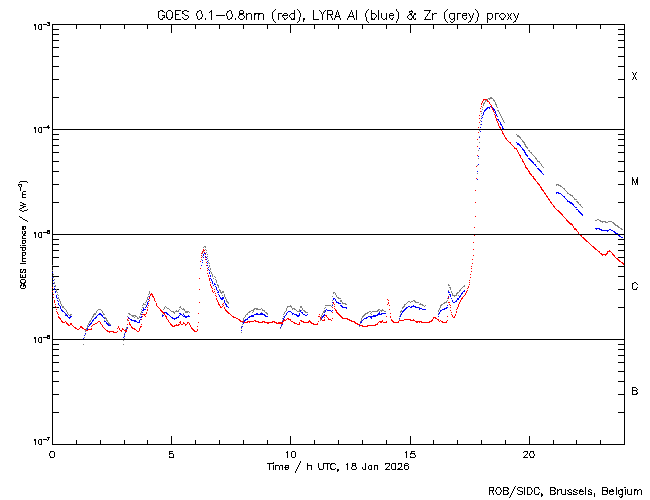
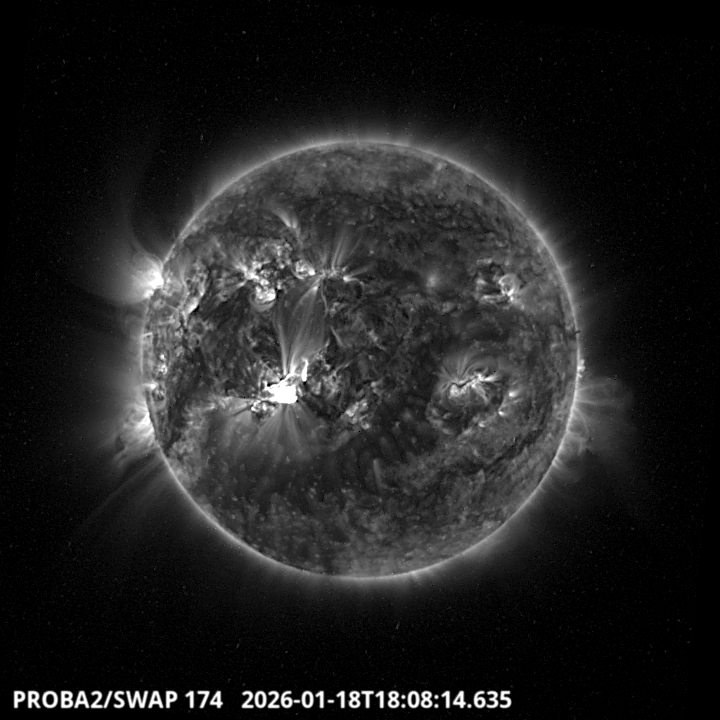
The largest flare of this week was an X1.9, and it was observed by LYRA (top panel) and SWAP (bottom panel). The flare peaked on 2026-Jan-18 at 18:09 UT and occurred in the South East part of the solar disk, originating from active region NOAA 4341. Find a SWAP movie of the event here: https://proba2.sidc.be/swap/movies/20260118_swap_movie.mp4
Noticeable Solar Events
| DAY | BEGIN | MAX | END | LOC | XRAY | OP | 10CM | TYPE | Cat | NOAA |
| 14 | 2010 | 2033 | 2052 | S14E73 | M1.6 | 1F | 4341 | |||
| 17 | 1019 | 1029 | 1032 | S7E35 | M2.1 | 2 | 71 | 4341 | ||
| 17 | 2346 | 2351 | 2354 | M1.1 | 71 | 4341 | ||||
| 18 | 1727 | 1809 | 1851 | S11E20 | X1.9 | 3 | V/1I/2 5 | 71 | 4341 |
| LOC: approximate heliographic location | TYPE: radio burst type |
| XRAY: X-ray flare class | Cat: Catania sunspot group number |
| OP: optical flare class | NOAA: NOAA active region number |
| 10CM: peak 10 cm radio flux |
Geomagnetic Observations in Belgium
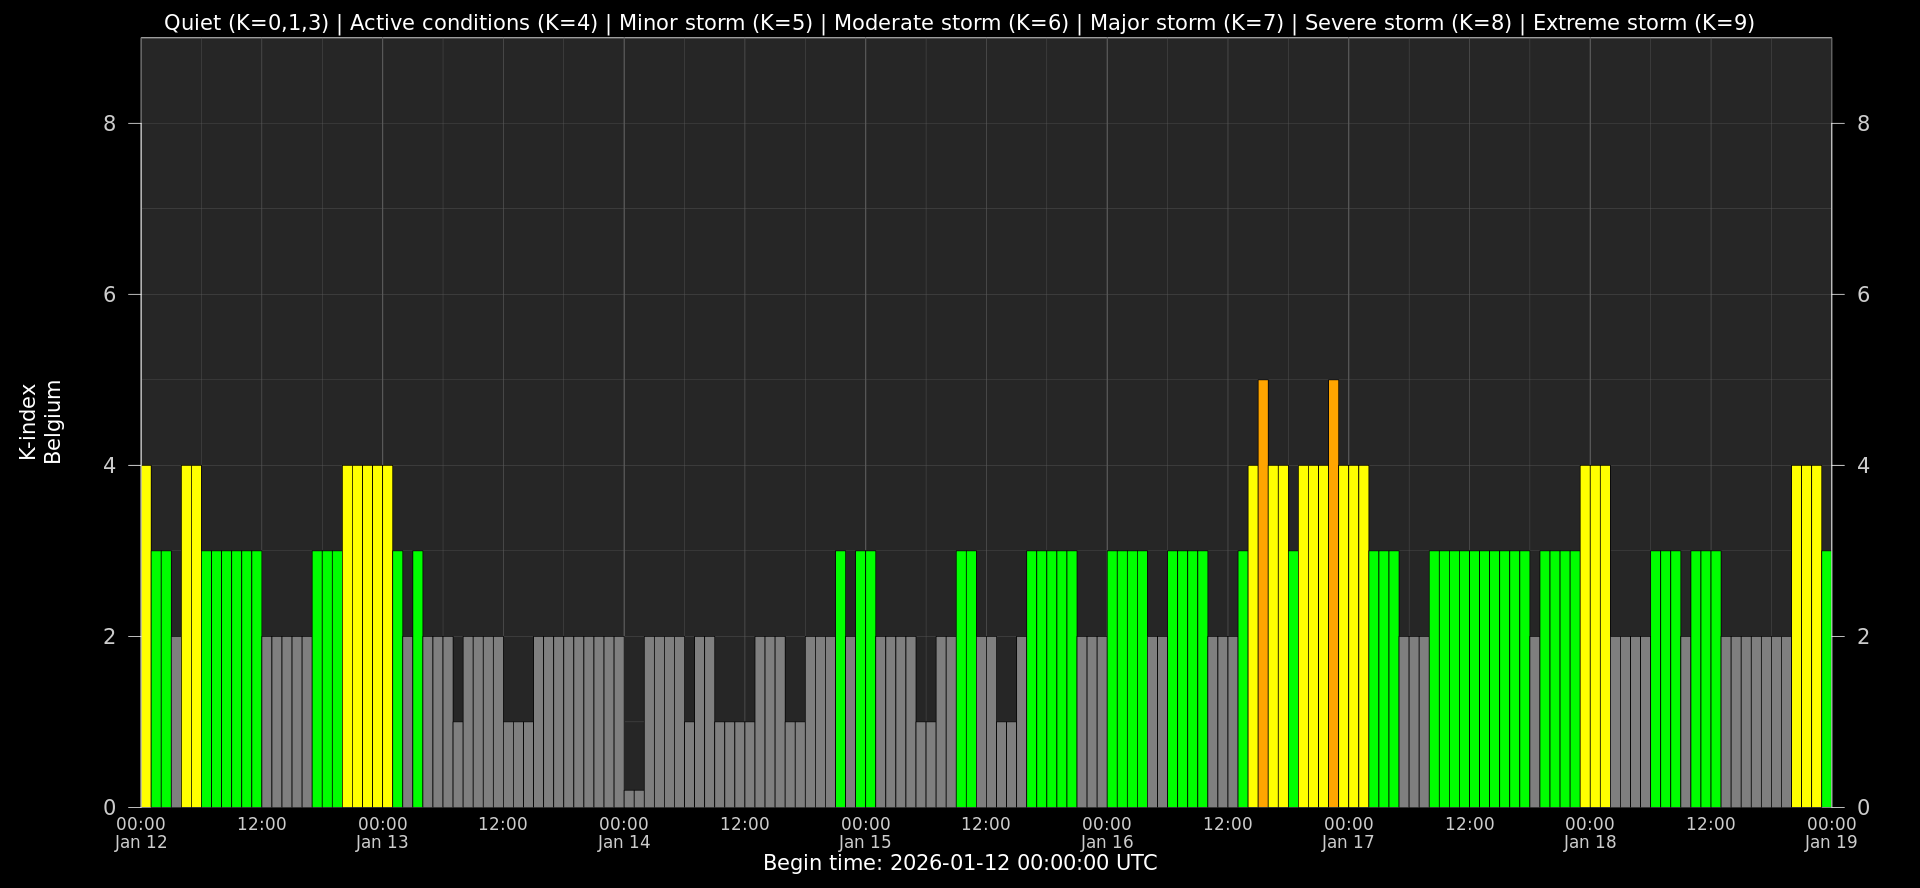
Local K-type magnetic activity index for Belgium based on data from Dourbes (DOU) and Manhay (MAB). Comparing the data from both measurement stations allows to reliably remove outliers from the magnetic data. At the same time the operational service availability is improved: whenever data from one observatory is not available, the single-station index obtained from the other can be used as a fallback system.
Both the two-station index and the single station indices are available here: http://ionosphere.meteo.be/geomagnetism/K_BEL/
Review of Ionospheric Activity

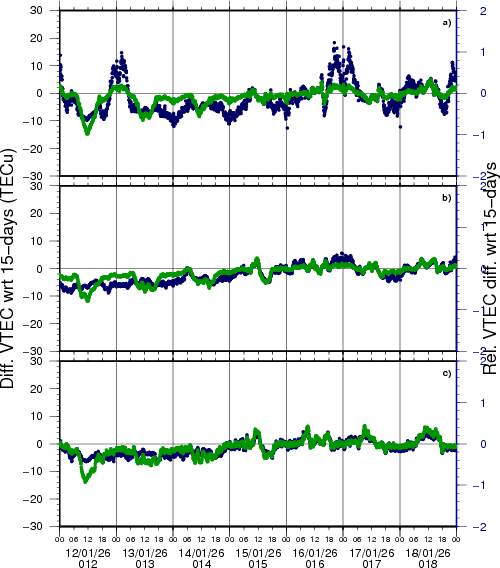
VTEC time series at 3 locations in Europe from 12 Jan 2026 till 18 Jan 2026
The top figure shows the time evolution of the Vertical Total Electron Content (VTEC) (in red) during the last week at three locations:
a) in the northern part of Europe(N 61deg E 5deg)
b) above Brussels(N 50.5deg, E 4.5 deg)
c) in the southern part of Europe(N 36 deg, E 5deg)
This top figure also shows (in grey) the normal ionospheric behaviour expected based on the median VTEC from the 15 previous days.
The time series below shows the VTEC difference (in green) and relative difference (in blue) with respect to the median of the last 15 days in the North, Mid (above Brussels) and South of Europe. It thus illustrates the VTEC deviation from normal quiet behaviour.
The VTEC is expressed in TECu (with TECu=10^16 electrons per square meter) and is directly related to the signal propagation delay due to the ionosphere (in figure: delay on GPS L1 frequency).
The Sun's radiation ionizes the Earth's upper atmosphere, the ionosphere, located from about 60km to 1000km above the Earth's surface.The ionization process in the ionosphere produces ions and free electrons. These electrons perturb the propagation of the GNSS (Global Navigation Satellite System) signals by inducing a so-called ionospheric delay.
See http://stce.be/newsletter/GNSS_final.pdf for some more explanations; for more information, see https://gnss.be/SpaceWeather
The SIDC Space Weather Briefing
The forecaster on duty presented the SIDC briefing that gives an overview of space weather from 12 to 18 January 2026.
The pdf of the presentation can be found here: https://www.stce.be/briefings/20260119_SWbriefing.pdf
Upcoming Activities
Courses, seminars, presentations and events with the Sun-Space-Earth system and Space Weather as the main theme. We provide occasions to get submerged in our world through educational, informative and instructive activities.
* Feb 9-11, 2026, STCE Space Weather Introductory Course, Brussels, Belgium - Fully booked
* Feb 18, 2026, STCE Public Lecture on Proba-3, Volkssterrenwacht Beisbroek, Bruges, Belgium
* Mar 16-18, 2026, STCE course: Role of the ionosphere and space weather in military communications, Brussels, Belgium - register: https://events.spacepole.be/event/258/
* Apr 20-21, 2026, STCE cursus: inleiding tot het ruimteweer, Brussels, Belgium - register: https://events.spacepole.be/event/260/
* Mar 23, 2026, STCE lecture: From physics to forecasting, Space Weather course, ESA Academy, Redu, Belgium
* Jun 15-17, 2026, STCE Space Weather Introductory Course, Brussels, Belgium - register: https://events.spacepole.be/event/256/
* Oct 12-14, 2026, STCE Space Weather Introductory Course, Brussels, Belgium - register: https://events.spacepole.be/event/257/
* Nov 23-25, 2026, STCE course: Role of the ionosphere and space weather in military communications, Brussels, Belgium - register: https://events.spacepole.be/event/259/
* Dec 7-9, 2026, STCE Space Weather Introductory Course for Aviation, Brussels, Belgium - register: https://events.spacepole.be/event/262/
To register for a course and check the seminar details, navigate to the STCE Space Weather Education Center: https://www.stce.be/SWEC
If you want your event in the STCE newsletter, contact us: stce_coordination at stce.be
Website: https://www.stce.be/SWEC