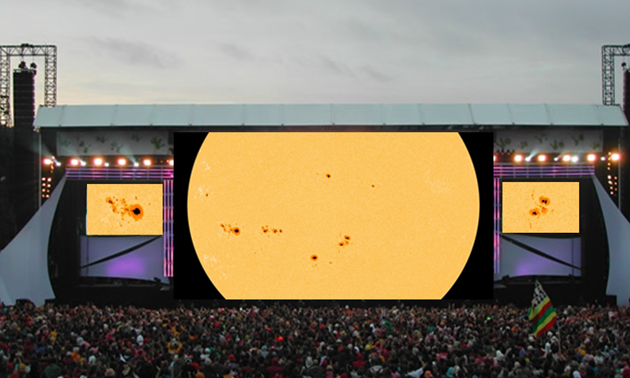
Coinciding with the traditional summer festivals, the Sun started a party on its own by producing a flurry of relatively large and complex sunspot groups. While on 29 June, the daily sunspot number was only 62, by 5 July it was at an estimated 152. The 10.7cm radio flux happily joined the festivities, by rising over the same time period from 126 to 193 solar flux units.

At the beginning of the week, the largest sunspot groups were NOAA 2104 and 2107. A few days later, the appearance of NOAA 2108 and 2109 near the southeast limb assured high sunspot numbers. NOAA 2104, 2108 and 2109 all reached a sunspot area about 4 times the surface area of the Earth. All these sunspot groups were located on the southern solar hemisphere.

Both NOAA 2104 and 2107 showed magnetic delta's (sunspots with opposite magnetic polarity within the same penumbra - see annotated image underneath), but like some overrated groups, they really were a disappointment in terms of strong flares. Actually they did not produce any M- or X-class flares at all. The same scenario unfolded for NOAA 2108 and 2109.

The top act of the week took place in small sunspot region NOAA 2106 on the northern hemisphere, or more precisely, in the filament to the south and west of this sunspot region. The M1.4 flare occurred on 1 July, and peaked at 11:23UT. The flare was associated to an EIT-wave (see this news item) and a coronal mass ejection. This CME was directed to the north and did not have an earth-directed component.

This movie first shows the evolution of the various sunspot groups in white light, then a closer view on the magnetic evolution of the main groups, topped by the M1 flare as seen in extreme ultraviolet, with the associated EIT-wave (PROBA2 difference images) and CME.
Credits - Data and imagery for the movie clips were taken from SDO, SOHO/LASCO, PROBA2, and Helioviewer.
 |
 |


