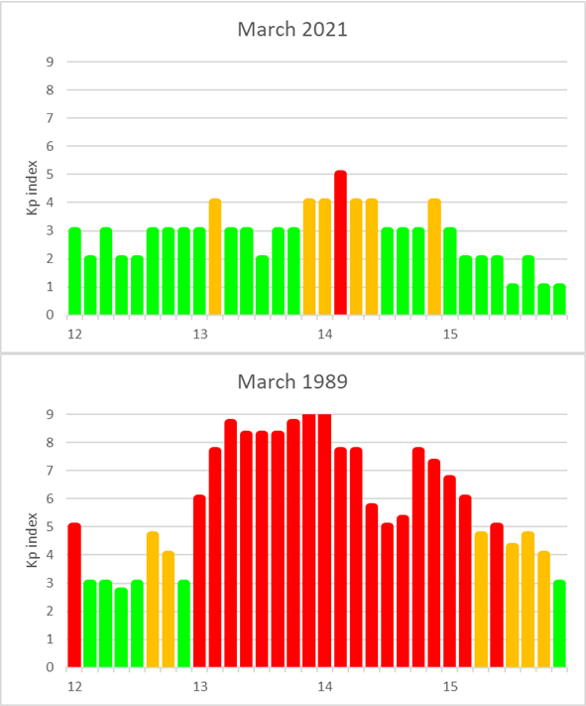
Last weekend, geomagnetic activity reached minor storm levels (Kp = 5) on 14 March, with active levels recorded on 13 March. The source of this activity was the arrival of a recurrent, negative polarity (i.e. magnetic field pointing sunwards) high-speed solar wind stream related to an extension from the southern polar coronal hole. Exactly on the same days, 32 years ago, the earth environment also experienced a geomagnetic storm, however this one reached extremely severe levels (Kp = 9) following the arrival of 2 coronal mass ejections (CMEs) launched by the huge sunspot group NOAA 5395 during the preceding days (Boteler, 2019). The difference in geomagnetic activity can be seen in the plots underneath, with the upper diagram showing the evolution of the Kp index from 12 till 15 March 2021, and the lower diagram covering the same period but for the year 1989 (see this newsitem for more info on the Kp index). No surprize then that the 13-14 March geomagnetic storm is considered as one of the strongest of the entire 20th century.

The space weather effects from this 1989 storm are well known. Aurorae were visible as far south as Cuba, while in Québec the power grid collapsed leaving millions without electricity for 9 hours. The number of "new" objects around Earth (space debris and satellites changing orbits due to atmospheric drag) rose from a daily average of 1000 to more than 6000 during and in the days following this geomagnetic storm. It took nearly a week to link and re-identify these "new" objects to known ones. The Solar Maximum Mission (SMM) for example, orbiting at about 450 km in altitude, was reported to have lost nearly 5 kilometers in altitude during this period. Radio communications became erratic, with some frequencies such as HF (High Frequency, 3-30 MHz) not working at all, while other frequencies such as certain VHF (Very High Frequency, 30-300 MHz) suddenly becoming available. A little known anecdote is that automatic garage doors in a California coastal suburb suddenly began to open and close without apparent reason. This curious phenomenon was eventually traced to a Navy ship that was using a special shore-based system in an attempt to maintain remote radio communications while HF radio was out of operation (Allen et al. 1989)!

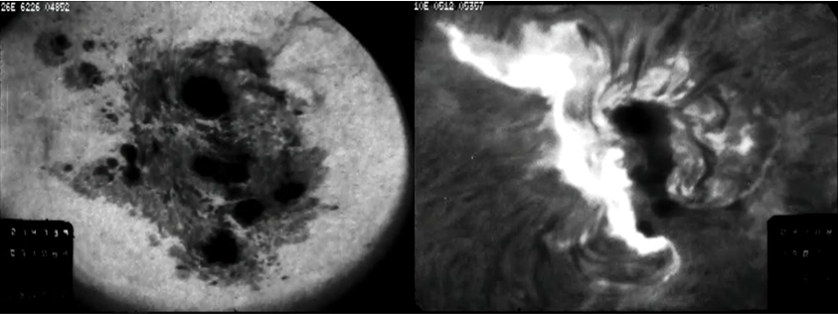
All together, NOAA 5395 produced 11 X- and 48 M-class flares during its solar transit from 6 till 19 March 1989. Underneath a view in white light and in H-alpha of the region on 10 March as recorded by telescopes at the Big Bear Solar Observatory. The H-alpha image shows an X4.5 flare in progress. The CME related to this flare is thought to be the first of the two CMEs leading to the 13-14 March geomagnetic storm. Images retrieved via the Solar Film Digitization project from the New Jersey Institute of Technology.


