
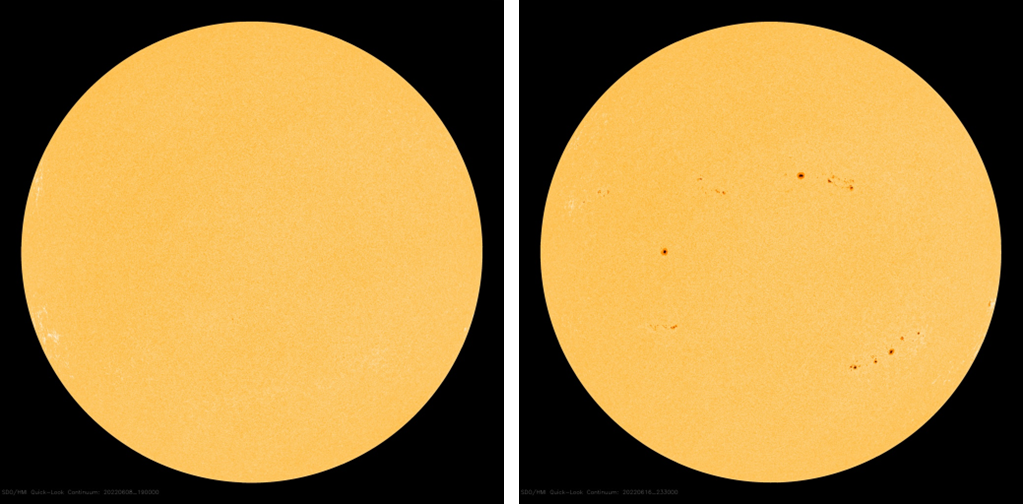
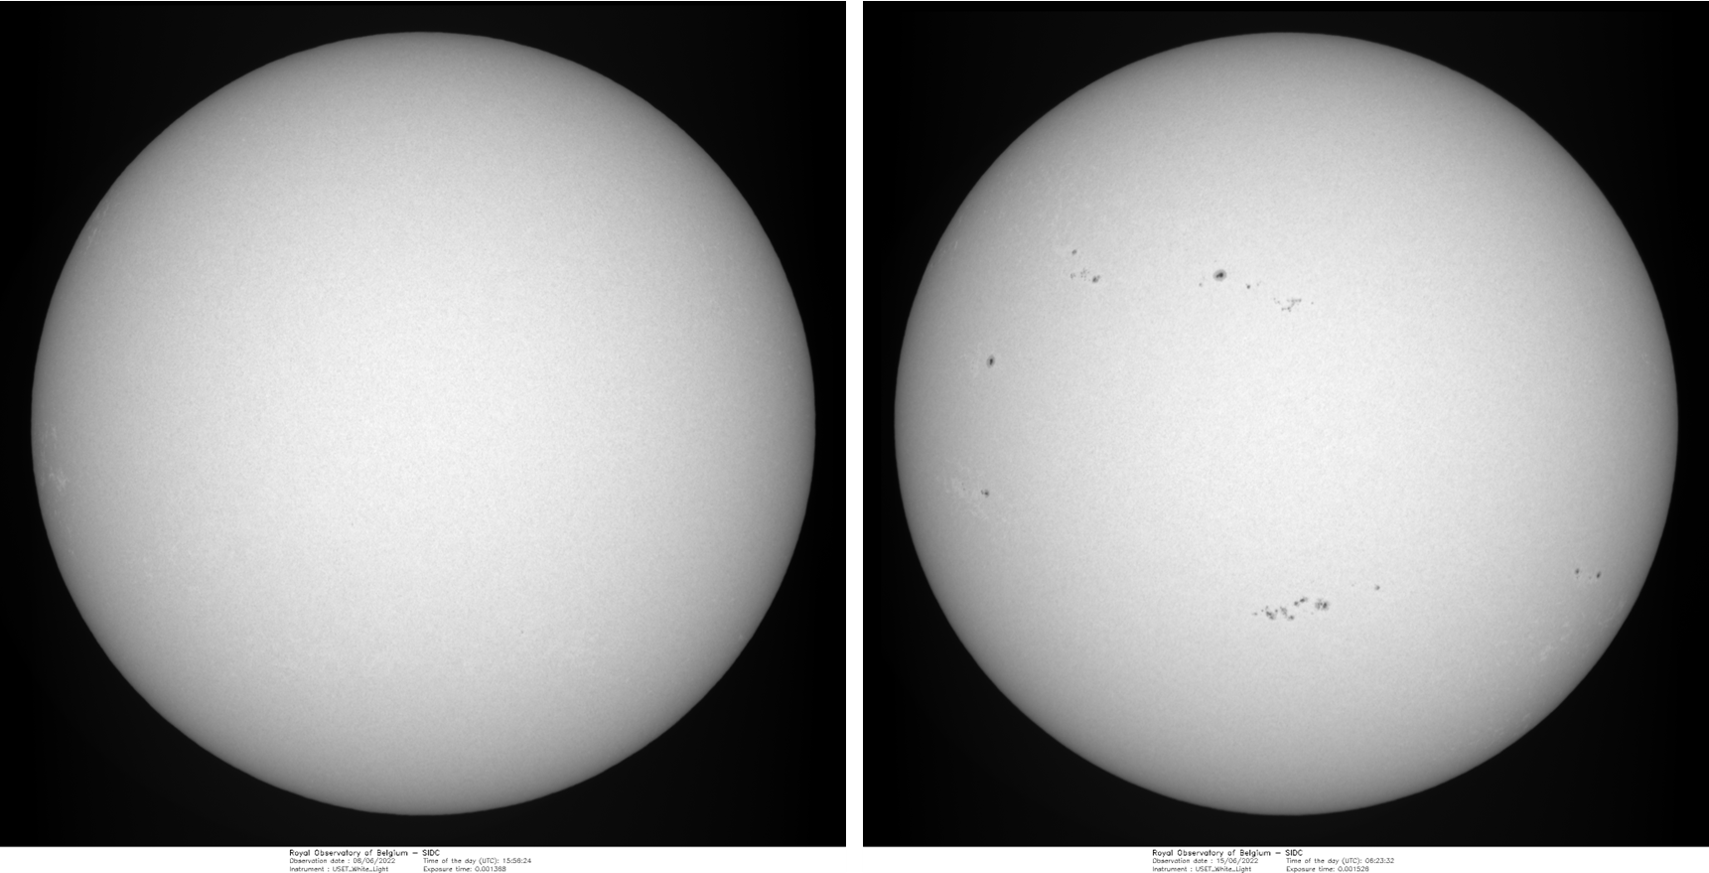
SILSO, the Sunspot Index and Long-term Solar Observations, has issued its most recent sunspot bulletin. These bulletins can be downloaded at https://www.sidc.be/silso/sunspotbulletin or you can register to receive these and other reports by mail (http://www.sidc.be/registration/registration_step1.php). For June, the provisional monthly mean International Sunspot Number (ISN) was 70.6, down from the 96.5 May value. The highest daily sunspot numbers were recorded on the 16th and 17th (both 151), and the lowest was a meager 4 on June, 8th. This was the lowest daily ISN since 11 December 2021, when it was 0 thus marking the last spotless day so far. Underneath a comparison highlighting the different outlook of the solar disk on 8 and 16 June (white light, SDO/HMI). See also this nice white-light comparison taken by ROB's USET-telescope on 8 and 15 June.
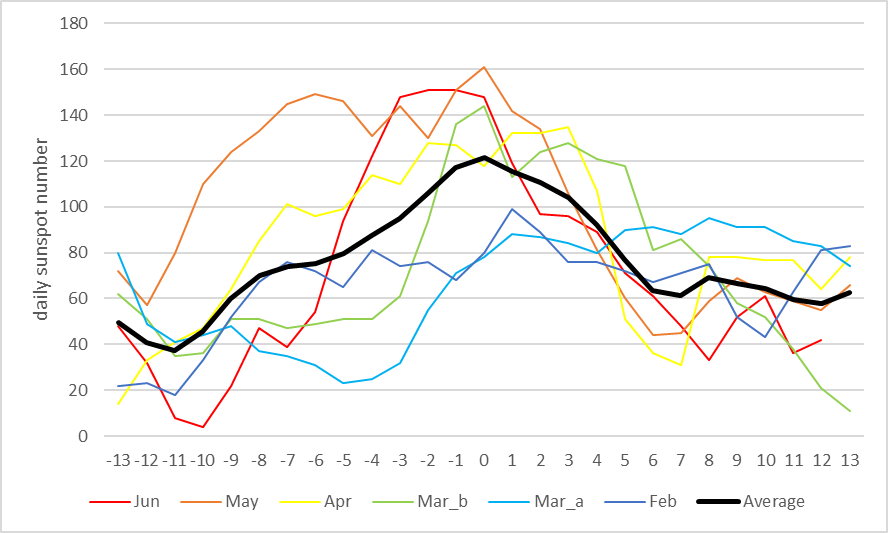
The period with high sunspot numbers is following remarkably well the 27-days solar rotation. Indeed, give or take a few days, the highest sunspot numbers for each solar rotation were around 3 February, 2 March, 29 March, 15 April, 22 May (161) and 18 June. This can be seen in the graph underneath showing the daily sunspot number from 2 weeks before to 2 weeks after the aforementioned dates (all brought back to day "0" on the horizontal axis). The curves with older sunspot numbers are in bluish, the more recent ones are in reddish. The average of the 6 rotations has been marked by a thick black line. An elevated sunspot number can be seen around day "0" for each of the rotations. The activity changes within the groups and the emergence and disappearance of sunspot groups (often short-lived) add to the variation outside the period of peak sunspot numbers.
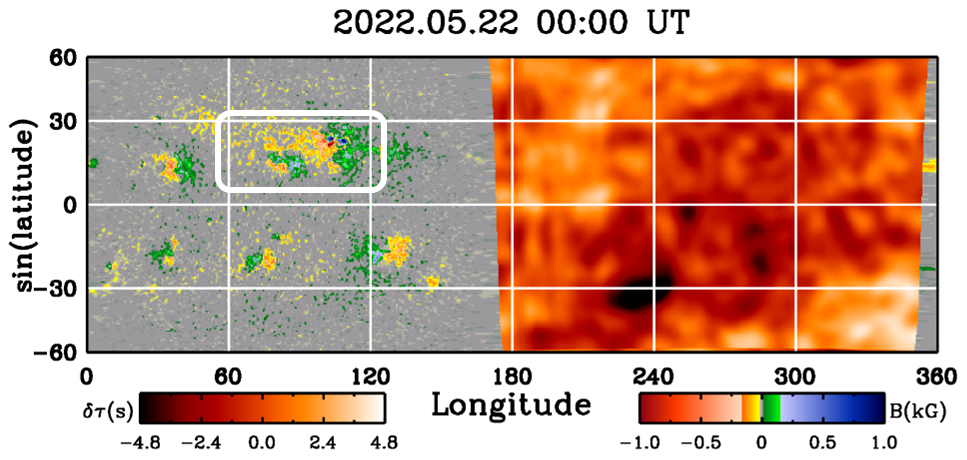
Being so closely tied to the solar rotation, the waxing and waning of the sunspot numbers has usually something to do with long-lasting active regions. As it turns out, the synoptic maps available at Stanford's TimeD webpage show such an active patch on the solar disk between solar longitudes 60 and 120 degrees and latitudes 15 and 30 degrees, as shown in the annotated image below. The colored greyish portion of the map is what is observed by SDO/HMI, whereas the orangish portion of the map is a farside image based on helioseismological results (see the STCE newsitem here and here). These maps indicate the area started to emerge during the second half of January. Numerous, different sunspot regions have developed inside this 60-degrees wide patch with no less than 36 M-class and 3 X-class flares originating from it alone since late March. The animation underneath shows the location and evolution of this active area on the Sun over the last 6 months, clearly revealing the emergence and dissipation of different active regions within it. Eventually though, this active area on the Sun will disappear.
Meanwhile, a team of researchers that included Frédéric Clette (lead scientist of SILSO), have scrutinized all the available sunspot numbers and sunspot areas. They showed, amongst other results, that the maximal growth rate of sunspot activity in the ascending phase of a solar cycle can serve as a reliable prediction of the subsequent cycle amplitude. With the available 13-month smoothed sunspot data till October 2021 of the rising phase of ongoing cycle 25, they derived as a lower estimate of its amplitude a value of 110+/-26, in line with other predictions (see the STCE's Solar Cycle Tracking page). Similar results were obtained using hemispheric sunspot numbers and areas. They further adapted their prediction technique for real-time application, so we'll certainly have updated predictions from this method in the near future, based then on the enhanced sunspot activity of the last few months. Their work has been accepted for publication in Astronomy and Astrophysics (Podladchikova et al., 2022).
