
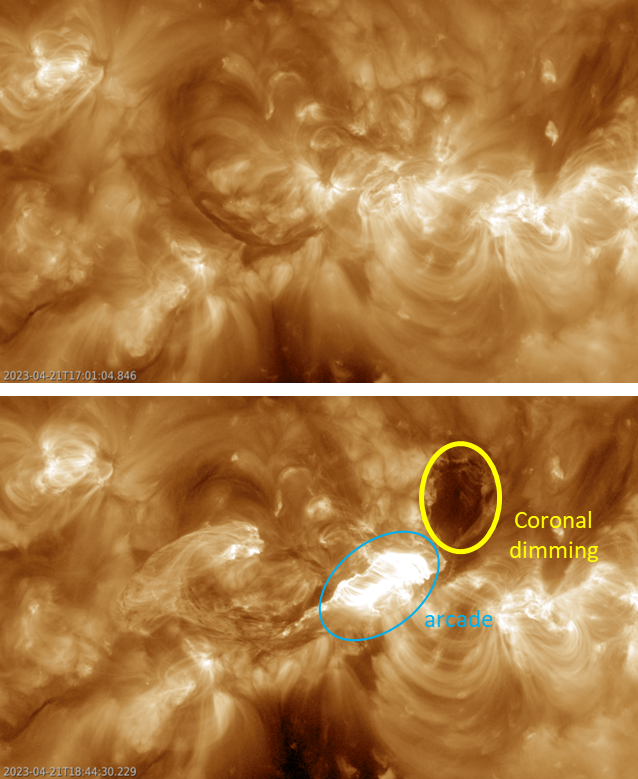
A violent eruption took place on the Sun on 21 April. The M1.7 flare was a long duration event (LDE) lasting an hour according to the GOES data and peaking at 18:12UTC. It originated from decaying active region NOAA 3283, consisting only of a few small sunspots at the time. More specifically, the eruption was a result of the interaction between the group filament and a much larger but quiescent filament to the east of this region. Solar filaments are clouds of charged particles ("plasma") above the solar surface squeezed between magnetic regions of opposite polarity. Being cooler and denser than the plasma underneath and their surroundings, they appear as dark lines when seen on the solar disk in suitable filters. The imagery underneath is from SDO/AIA 193 showing the filament eruption, as well as post-eruption coronal loops ("arcade"; mainly over NOAA 3283) and coronal dimming to the northwest of NOAA 3283 (annotated). Of note is that the quiescent filament recomposed itself after the eruptive event. The arcade and the coronal dimming were 2 indications that a coronal mass ejection (CME) was associated with this solar flare. A full halo CME was indeed observed by coronagraphs such as SOHO/LASCO, starting at 18:12UTC. The CME had a speed in excess of 1100 km/s and was squarely directed to Earth. The event was also associated with an enhancement of the greater than 10 MeV proton flux (GOES).
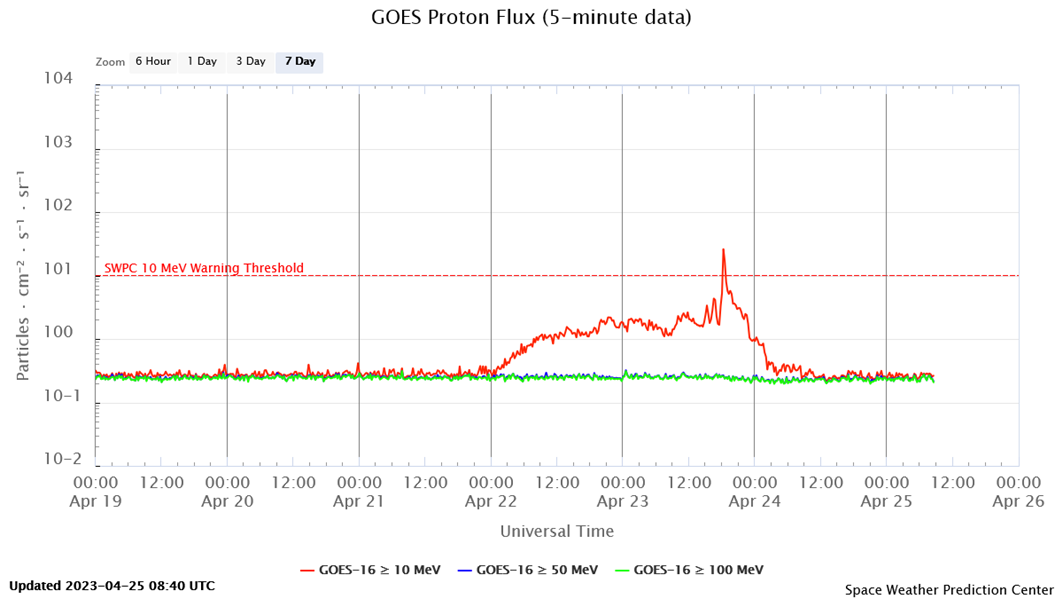
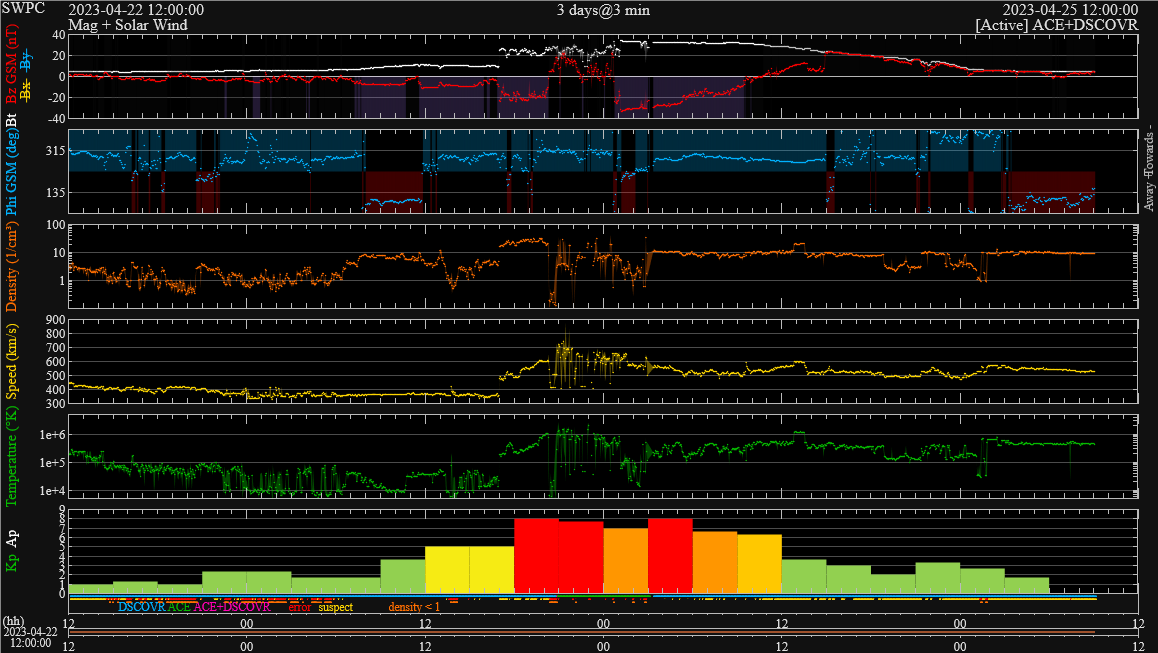
A shock was recorded in the solar wind parameters on 23 April at 17:00UTC (DSCOVR ; graph). It marked the somewhat (a few hours) earlier-than-expected arrival of the interplanetary coronal mass ejection (ICME). The passage of the shock briefly drove the already enhanced greater than 10 MeV proton flux finally above the proton event threshold (10 pfu), with a maximum of 26 pfu recorded at 18:20UTC (graph underneath). This is called an Energetic Storm Particles event (ESP), and originates from the acceleration of charged particles by a fast, usually ICME-driven shock in interplanetary space (e.g. Ameri et al. 2023). The proton flux drops sharply after the shock passage, as was the case here. Solar wind speed jumped from 360 to 475 km/s, then gradually further increased to values near 700 km/s by 21:00UTC. Bz, the north-south component of the interplanetary magnetic field, showed 2 prolonged periods of negative values: during the 17-20UTC interval, when its value was at a fairly stable -24 nT, and again on 24 April during the 01-09UTC interval when Bz evolved from -33 nT to -9 nT. The Bz value of -33 nT was the lowest since the 7 September 2017 storm (also -33 nT). For even more negative Bz, we have to go back all the way to the Solstice storm of 22 June 2015 when it reached values of -39 nT.
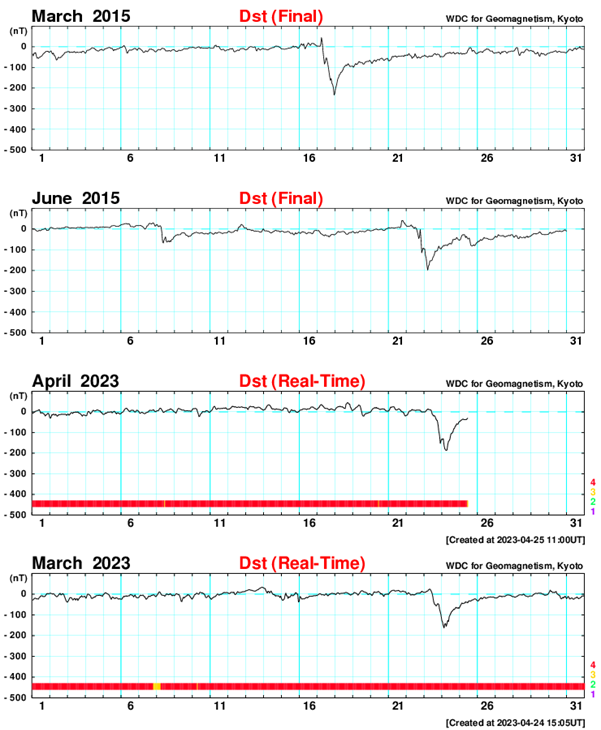
The passage of this strong ICME obviously resulted in a severe geomagnetic storm, the second in a month (see this STCE newsitem). The estimated Kp index (NOAA) reached 8 on 23 April during the 18-21UTC interval and again on 24 April during the 03-06UTC interval, whereas the local K_BEL index topped at 7 during the 20-23UTC period. The (provisional) Disturbance storm-time index (Dst - see the STCE SWx classification page) dropped all the way to -187 nT, well below its value during the severe 24 March geomagnetic storm (-163 nT), thus making it the strongest storm so far this solar cycle. We have to go back all the way to 2015 to find even more negative values: the St-Patrick's Day storm resulted in a Dst of -234 nT on 17 March 2015, and during the already mentioned Solstice storm the Dst index reached -198 nT. The stack of graphs underneath shows the Dst evolution for the aforementioned geomagnetic storms. Note only the Dst values for the 2015 storms are final (Kyoto WDC for Geomagnetism).
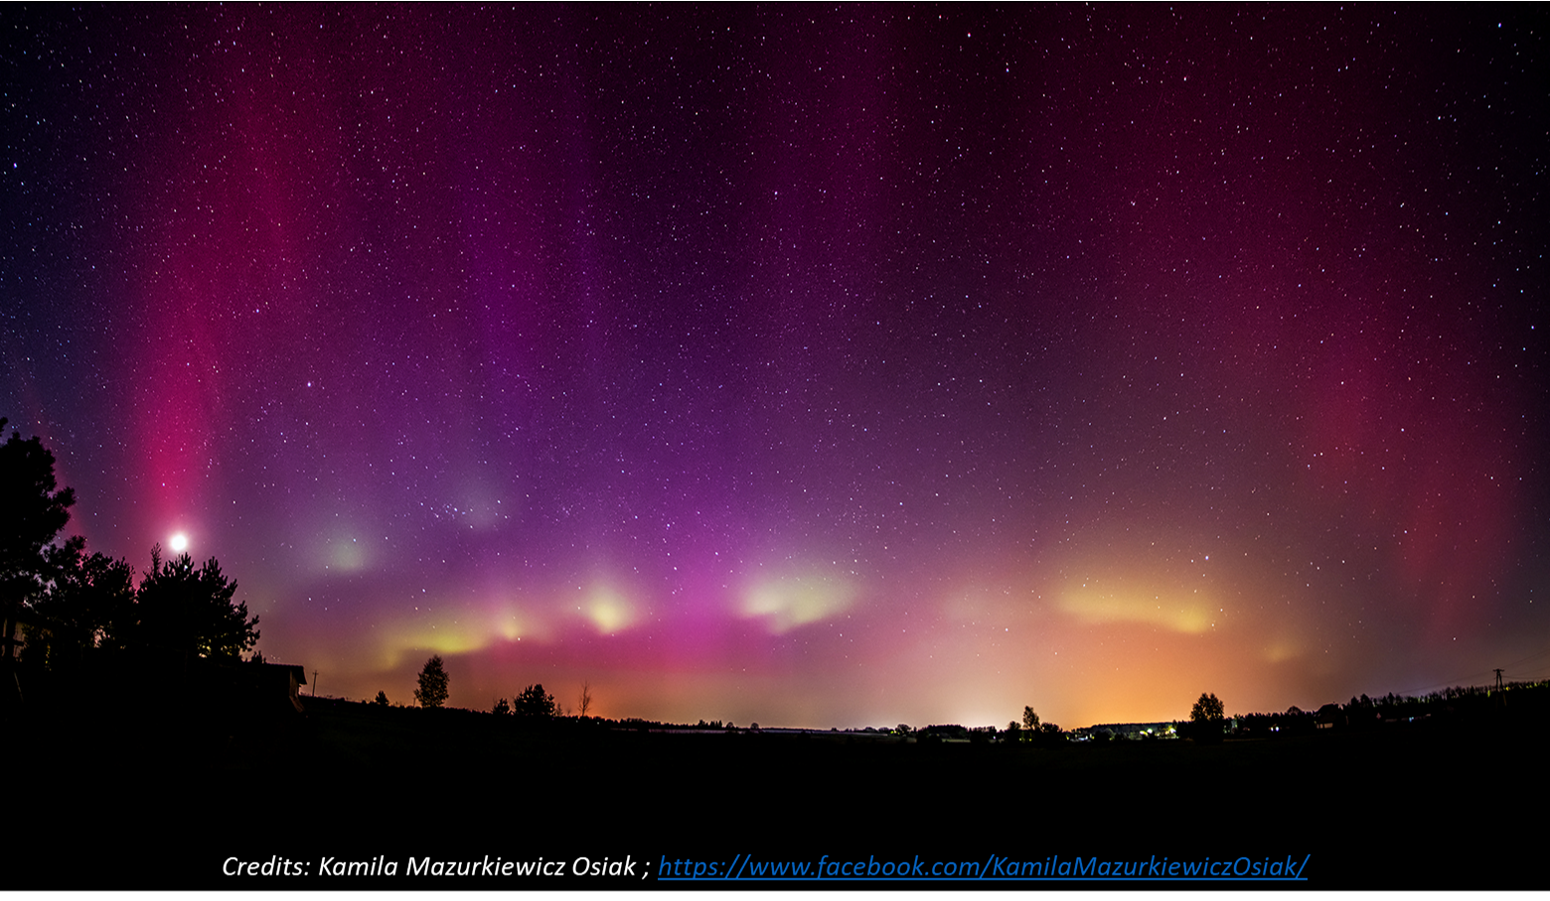
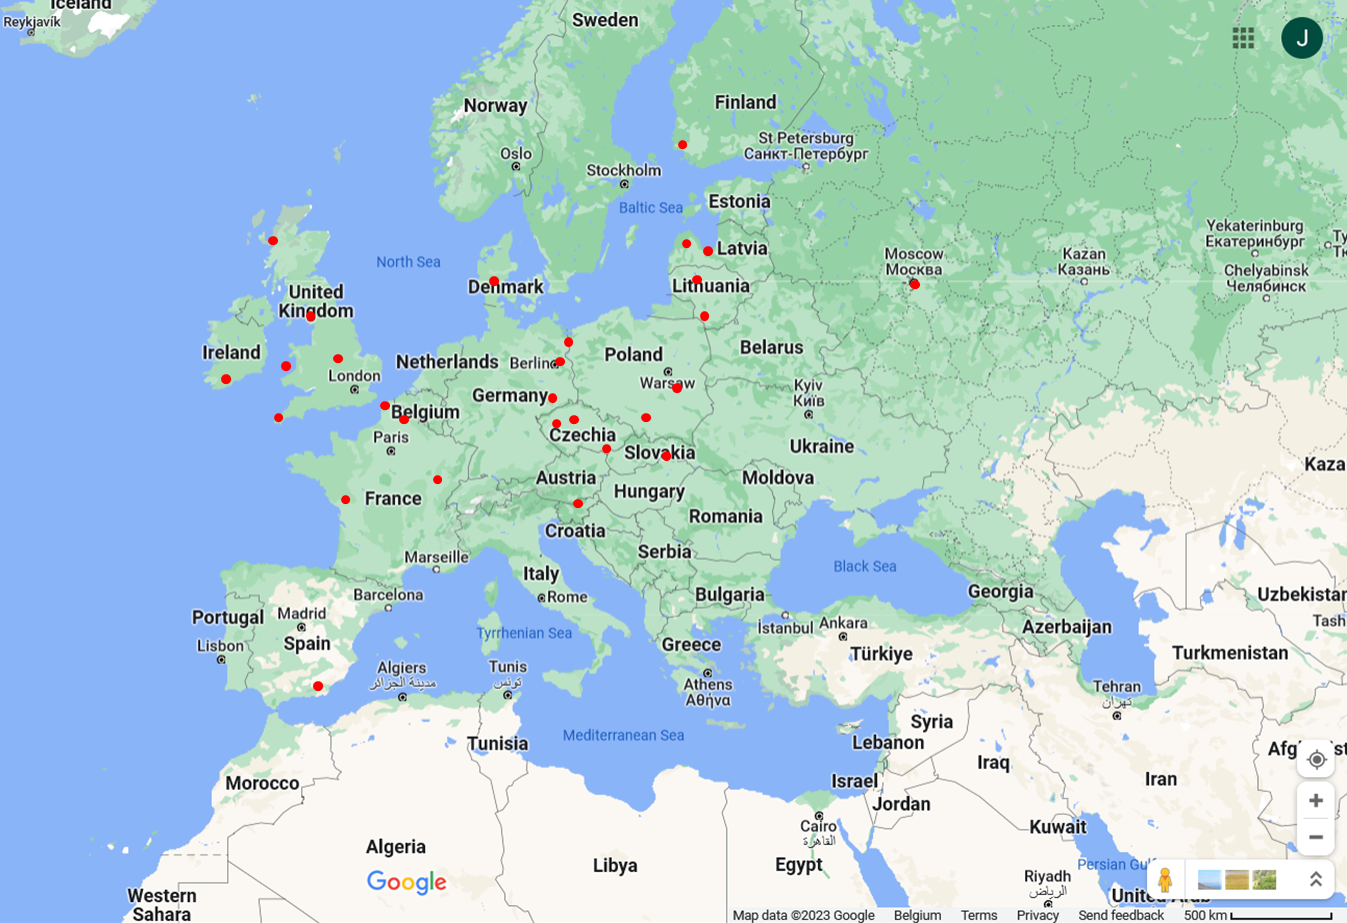
The geomagnetic storm resulted in quite spectacular polar lights that were observed and photographed from locations far away from the aurora's usual visibility zone. Reports from Spaceweather.com indicated that the aurora were photographed as far south as Texas and California in the United States, and from Slovenia and Southern Spain in Europe (map). The breathtaking picture underneath was taken by Kamila Mazurkiewicz Osiak (https://www.facebook.com/KamilaMazurkiewiczOsiak/ ) near Pulawy, Poland on 23-24 April. It captures the amazing, out-of-this-world auroral colours as well as the isolated, green auroral patches, as commented on by some observers. Many mid-latitude aurora watchers reported either that it was their first-time observing of green aurora, or that it had been many years since their last observation of these green polar lights. As a reminder: the red hues of the aurora are typically found at higher altitudes (200 km or higher) than the green coloured aurora (between 100 and 200 km) and thus can be seen from further away than the green ones (see BIRA-IASB).
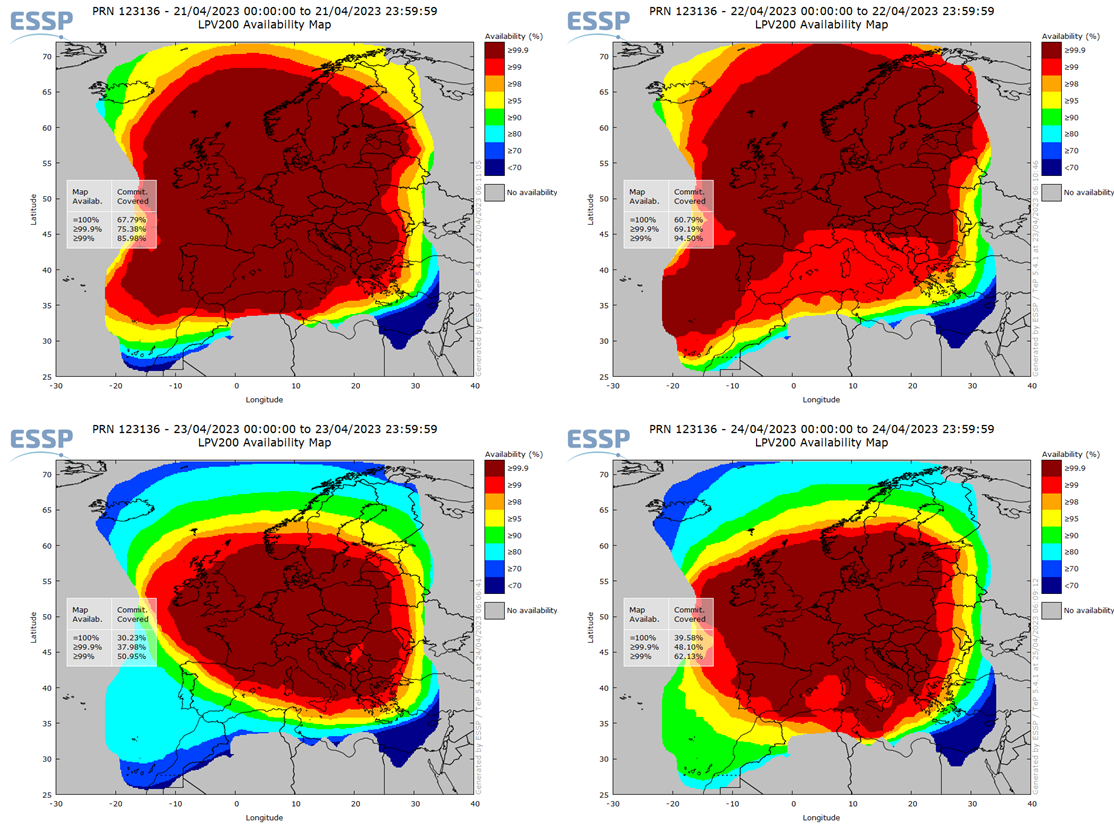
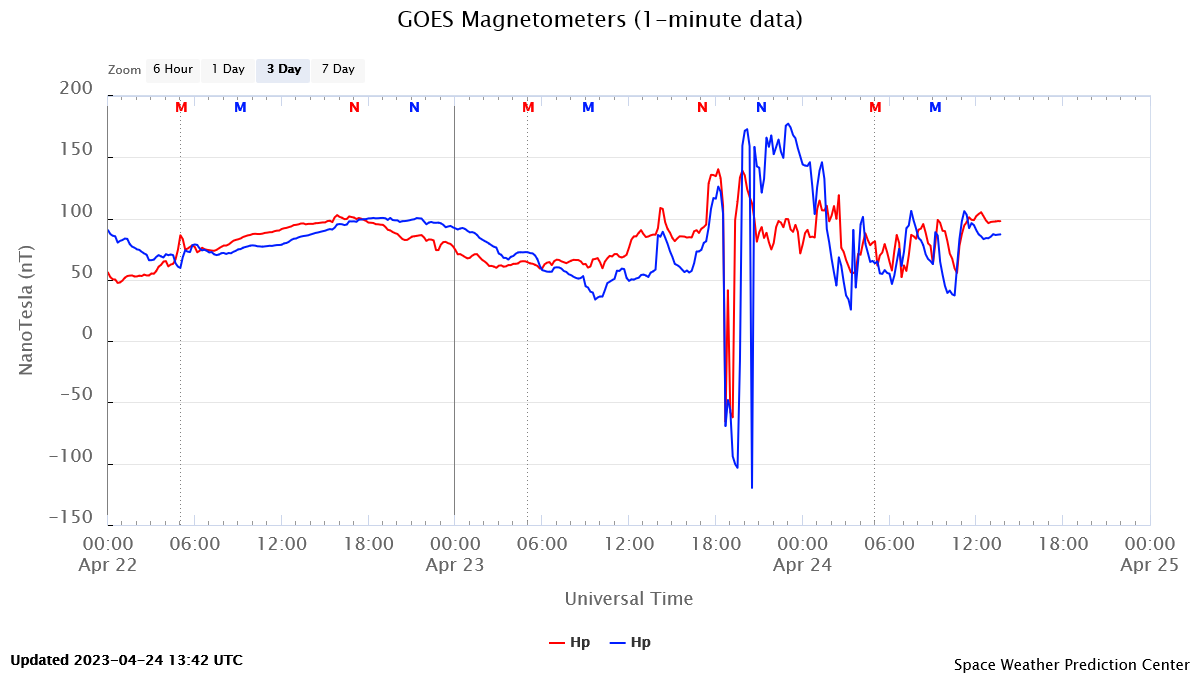
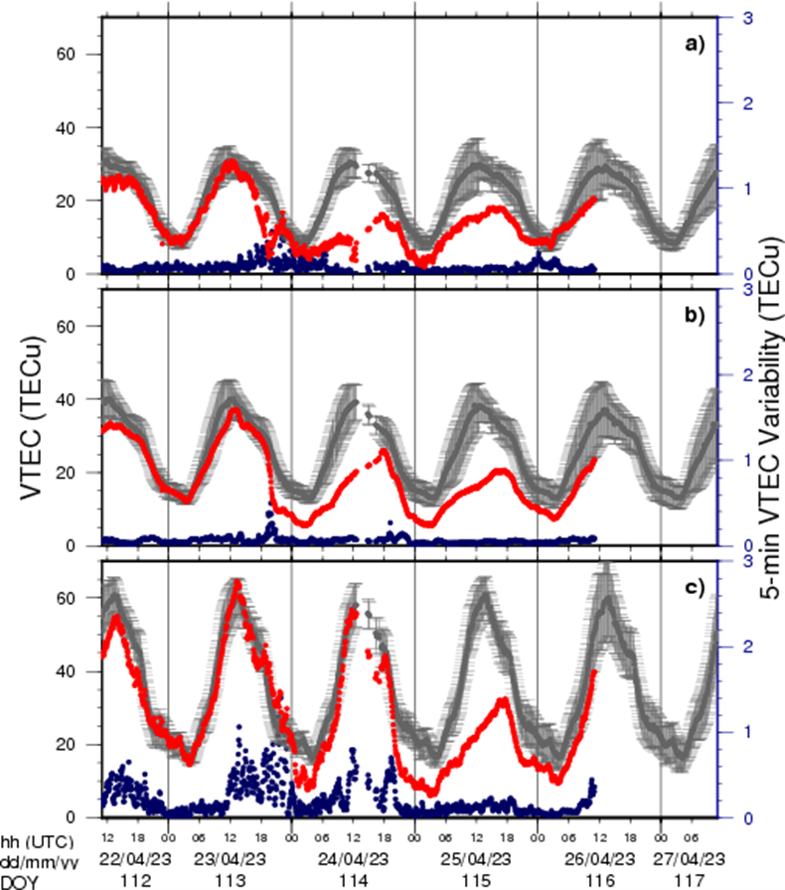
There were plenty of other space weather effects. The solid ICME pushed the magnetopause so far inwards, i.e. to the Earth, that geostationary satellites such as GOES briefly became exposed to the turbulent solar wind during their noon passage (between the Earth and the Sun) on 23 April between 18 and 21UTC (graph). No problems have been reported so far from these "magnetopause crossings". The minor solar radiation storm (proton event) resulted in some moderate disturbances in the high frequency (HF) radio communication, the so-called Polar Cap Absorption. Civil aviation got quite heavily impacted with PECASUS operators sending out as many as 18 advisories for HF Com during the 23-25 April timeframe (see also this STCE newsflash). Most of those (11) were for Post-Storm Depression of the HF frequencies, i.e. that not all frequencies were available during this period. This reflected again a highly disturbed ionosphere, highlighting the strong negative phase of the associated ionospheric storm at high- and mid-latitudes (ROB/GNSS ; map ; STCE newsitem). The disturbed ionosphere also affected Global Navigation Satellite Systems (GNSS) based applications for the civil aviation (another 7 advisories...). As can be gauged from the imagery underneath covering the period 21 to 24 April, some of these applications did not reach their typical availability over Europe (EGNOS) while the geomagnetic storm was ongoing. Red/brown colours mean good availability, blue means significantly degraded availability. LPV-200 (Localizer Performance with Vertical guidance) delivers accurate information on an aircraft’s approach to a runway with the use of GNSS positioning technology. The result is lateral and angular vertical guidance without the need for visual contact with the ground until an aircraft is 200 feet (60 meters) above the runway (see EUSPA).
