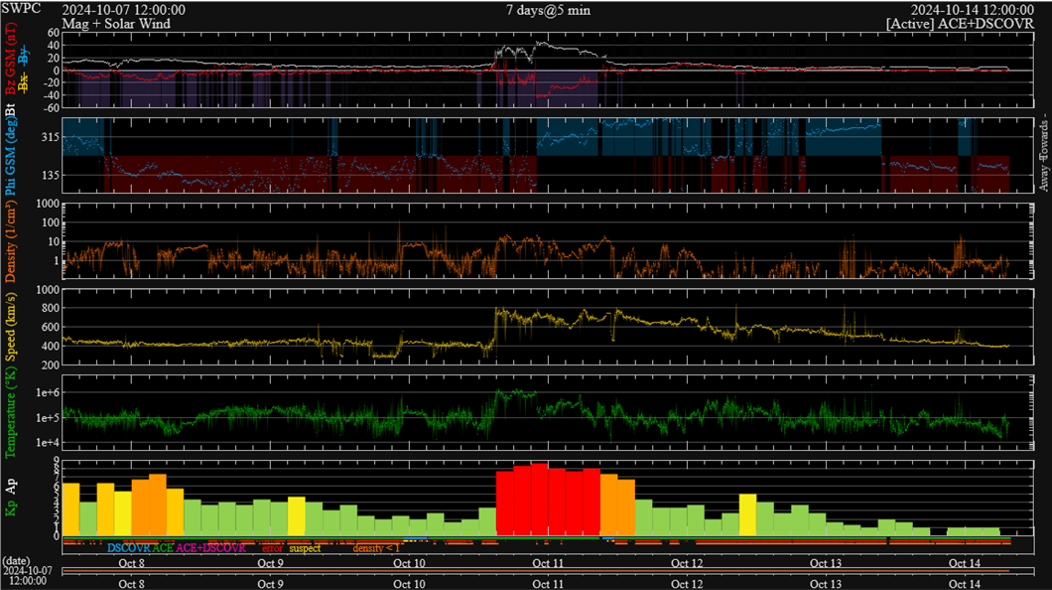
The interplanetary coronal mass ejection (ICME) that was associated with the X1.8 solar flare early on 9 October arrived shortly after noon on 10 October (STCE newsitem). Solar wind speed (yellow curve) jumped from 400 to around 800 km/s, while, at its strongest, Bz (red curve) reached -46 nT and was around -45 nT for nearly 2 hours. The resulting geomagnetic storm was at severe levels for 18 consecutive hours, and reached 9- during the 21-24UTC interval on 10 October (around local midnight in Belgium). A map combining solar wind data and the Kp index can be found underneath (DSCOVR). The provisional Dst index reached -335 nT during the 01-02UTC interval on 11 October. Both indices made this the second strongest geomagnetic storm so far this solar cycle, only superseded by the 10-11 May storm earlier this year when the Kp and Dst index reached resp. 9o and -412 nT.
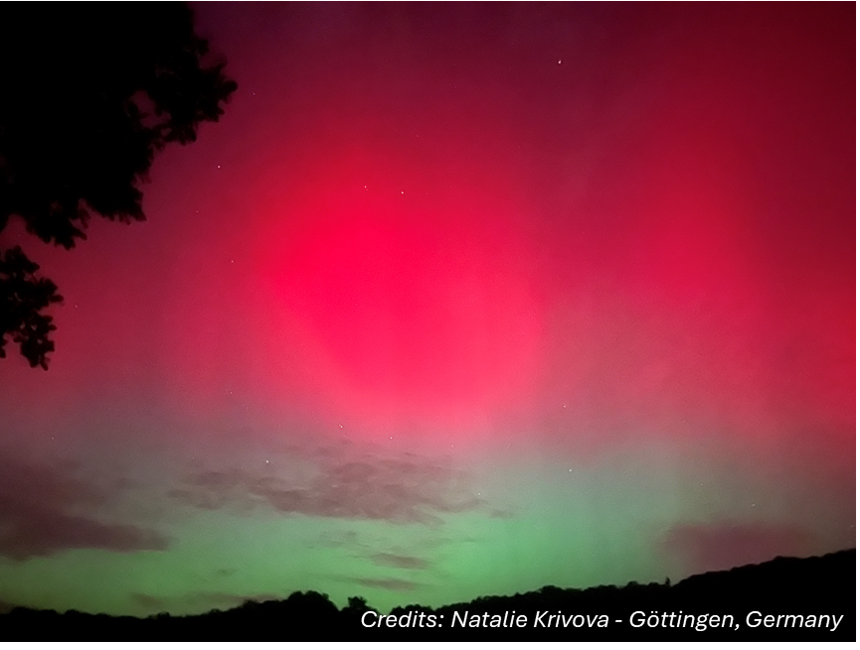
Though this storm was slightly less severe than the May storm, aurora have been observed and/or photographed as far south as California and Texas in the United States, and from Italy and Greece in Europe (Spaceweather.com). Also observers in South-Africa and Australia reported on the colourful lights in the night sky. Aurora were well observed from the Netherlands and Germany, and through cloud breaks from Belgium (HLN, VRT). The impressive image underneath was taken by Natalie Krivova from Göttingen, Germany late on 10 October.
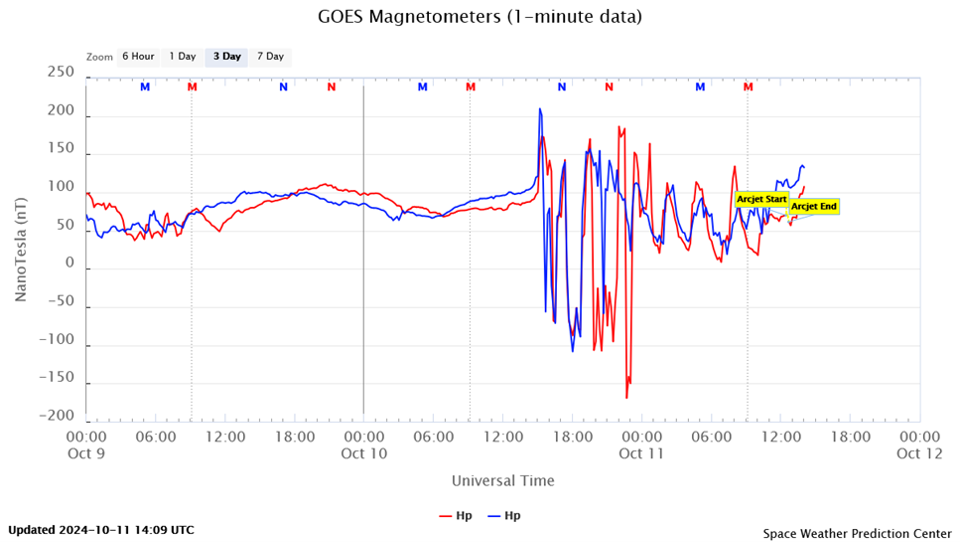
Satellites in geostationary orbits such as GOES were exposed to the turbulent solar wind as the ICME pushed the protective magnetopause closer to the Earth than the altitude these satellites were orbiting. This can be seen in the graph underneath showing measurements of a component of the Earth's magnetic field by GOES. Between about 15UTC and 01UTC, there are clearly strong variations in the observed values, a lot stronger than the quiet daily undulation. It means that GOES was exposed to the turbulent solar wind for about 10 hours, complicating spacecraft operations and research.
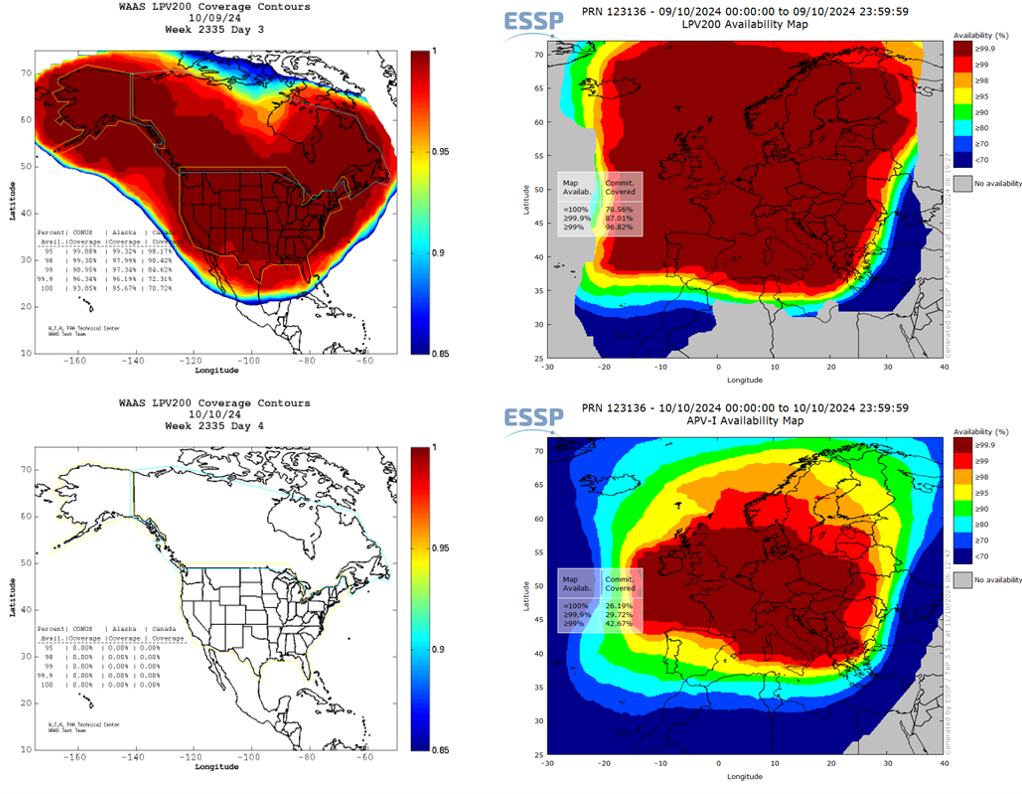
Certain GNSS applications (Global Navigation Satellite Systems, such as GPS and Galileo) were disturbed or entirely unavailable. This was for example reflected in the reduced availability of some GNSS-based aviation tools, such as LPV200 - the vertically-guided landing approach aid for airplanes to as low as 200 feet (61 meters) above ground level (WAAS , EGNOS ; STCE newsitem for more info). A brown colour is good availability, blue means significantly degraded. For WAAS, LPV200 availability was even absent from around 20UTC on 10 October until 12UTC on 11 October, i.e. during the most powerful phase of the geomagnetic storm. Some advisories were sent to the civil aviation for disturbances of GNSS (PECASUS). Also, so far, no reports were filed about crashed drones or desperate farmers as was the case during the May storm (STCE newsitem).
The GNSS section of the Royal Observatory of Belgium (ROB/GNSS) recorded a very strong negative phase of the associated ionospheric storm (map ; see this STCE newsitem for more info on the phases of an ionospheric storm). As a result, from 11 October onwards, the upper portion of the high frequencies (HF; 3-30 MHz) was depressed at certain locations and for certain intervals. PECASUS/CRC has sent several advisories to civil aviation for this so-called post storm depression, as well as for auroral absorption - another source contributing to disturbed HF communications.
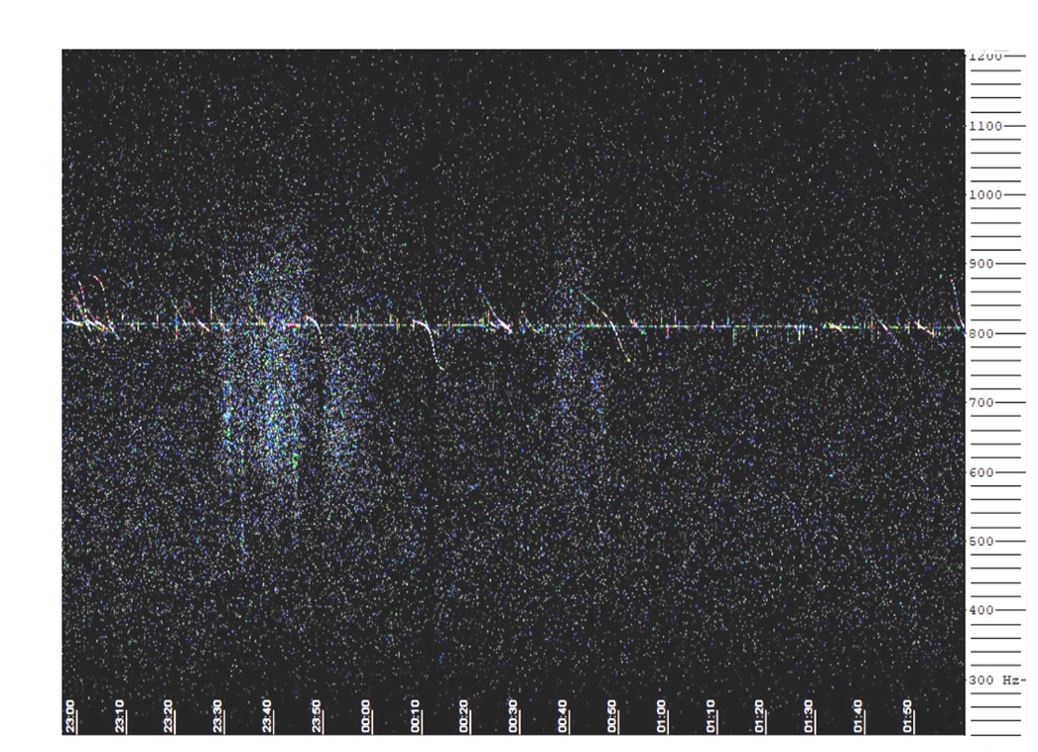
Belgian radio meteor observers from the BRAMS network (Belgian RAdio Meteor Stations ; see this STCE newsitem for more info on BRAMS) recorded considerable noise in their radio displays hampering a good detection of any radio signature from a passing meteor. In the image underneath, time is on the horizontal axis and vertically there's band of a few 100 Hz wide near the radio frequency of the beacon at 49.99 MHz (Ypres, Belgium; courtesy Felix Verbelen). The reversed "S"-shapes are reflections from passing airplanes. The strongest noise is visible between 23:30 and 24:00UTC on 10 October, right around the time of the most severe phase of the geomagnetic storm. The disturbance on these radio beacons was much less pronounced than during the May storm, when even the direct signal was barely visible in the spectrograms during the main phase of the storm (see the STCE newsitem).
Geomagnetically Induced Currents (GIC ; see this STCE newsitem for an example ) have also been observed worldwide, but -so far- also here no reports of strong effects or damage. As readily could be seen in the NOAA/USGS maps, the observed voltages about 5V/km) were slightly lower than in May, and only a quarter of the values observed during the big storm of March 1989 which was the cause of the Quebec power grid failure. Similar conclusions can be drawn for Europe. The Eskdalemuir Observatory in Scotland (BGS) recorded rates of change in the magnetic field components as large as 315 nT/min (see maps underneath; from ESA SWx portal), which is slightly weaker than in May this year (395 nT/min) and about a third of what was recorded by this observatory during the March 1989 storm (934 nT/min - see C. Beggan).
So, though the 10-11 October storm certainly was not as strong than the 10-11 May 2024 storm, it certainly left its footprint in various technological domains.


