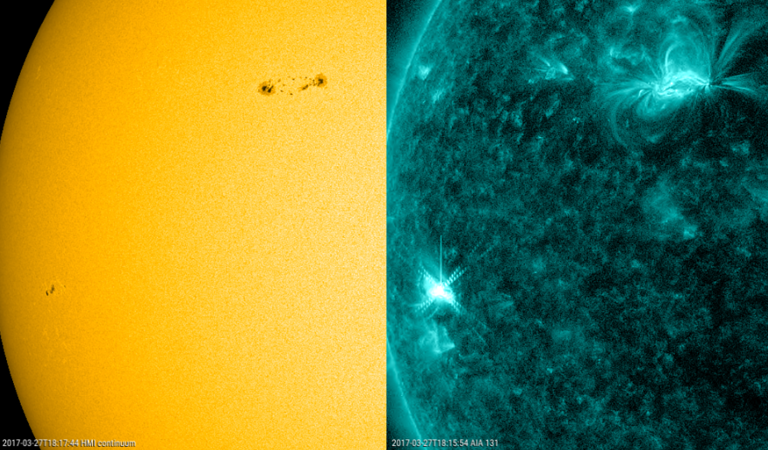
Late on 26 March, the GOES-15 satellite recorded its first C-class flare in more than a month (24 February). The source region was developing sunspot group NOAA 2644, which evolved into a mature group over the next days. Meanwhile, another small but compact group was emerging near the southeast solar limb. NOAA 2645 quickly took the lead in being the most flare productive region, producing a C5 flare on 27 March, the strongest event since 21 January this year. The SDO images underneath show both regions at the time of the C5 flare in white light (left) and in extreme ultraviolet (right; AIA131). The subsequent animation shows the development and flaring activity of both groups.


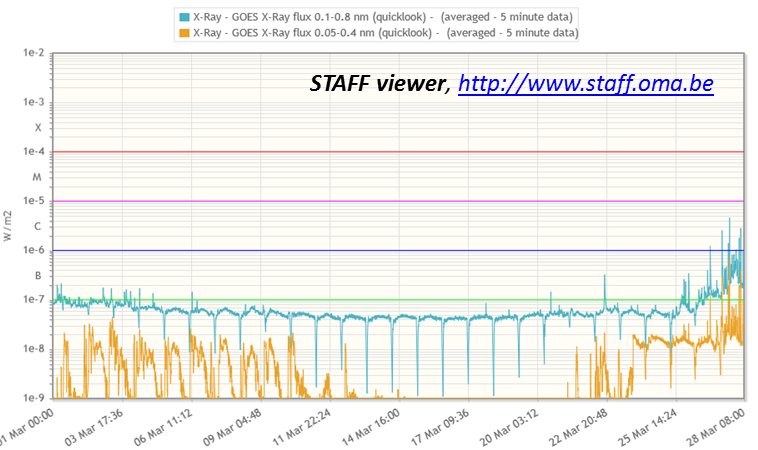
As already indicated, the latest series of C-class flares marks a sudden upswing in solar activity. In fact, these are the first solar flares for this month (March 2017). The very low activity can be seen in the GOES-15 x-ray measurements underneath, with even B-class flares absent for 2 weeks. The daily dips in the x-ray curves are eclipses of the GOES satellite by the Earth.

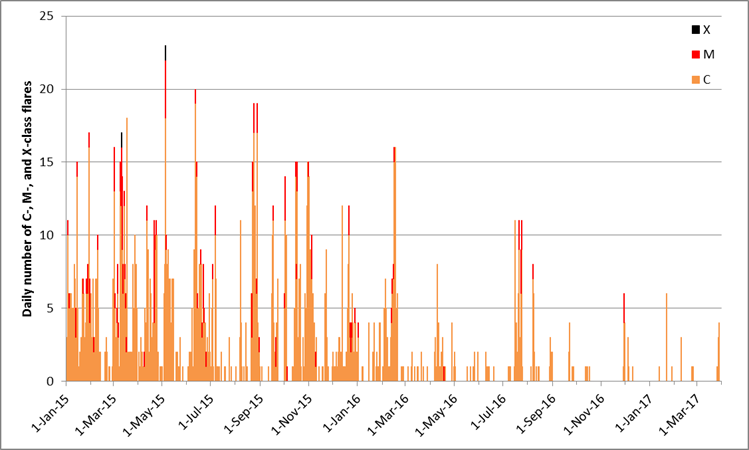
Since the latest solar cycle maximum, solar activity has been gradually waning. This can be seen in the graph underneath, depicting the daily number of C-, M- and X-class flares (Common, Medium and eXtreme flares). A general decrease can be seen in the number and intensity of the solar flares. The last X-class flare dates back already from 5 May 2015, and the last M-class flare from 29 November 2016. Also, the average waiting time between flares has also steadily been growing. In 2015, daily C-class flares were the norm, with M-class flares regularly occurring. Since September 2016, we only had 2 (two) M-class flares and about 50 C-class flares. Worst of all, with the upcoming solar cycle minimum, the situation is unlikely to improve. Solar observers will have to live from an occasional resurgence of sunspot and flaring activity, similar to the ongoing episode. Wouldn't it be great we can report next week on an M-class flare?...


