
Over the last 2 weeks, solar activity was dominated by the small but complex sunspot group NOAA 2297. Under its dictatorship, no less than 97 "common" C-class flares, 23 "medium" M-class flares and 1 "extreme" X-class flare were produced. This makes it one of the most flare productive groups of the current solar cycle so far, very comparable to e.g. NOAA 1515 from July 2012 (see Note 1).
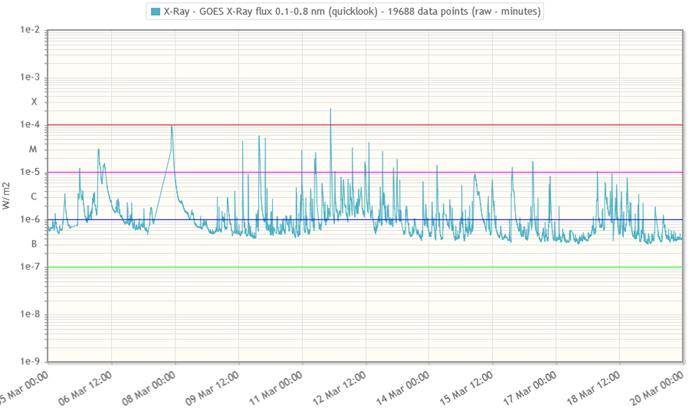
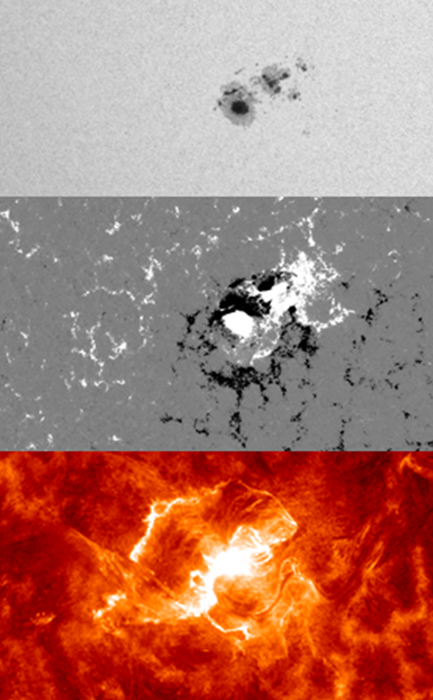
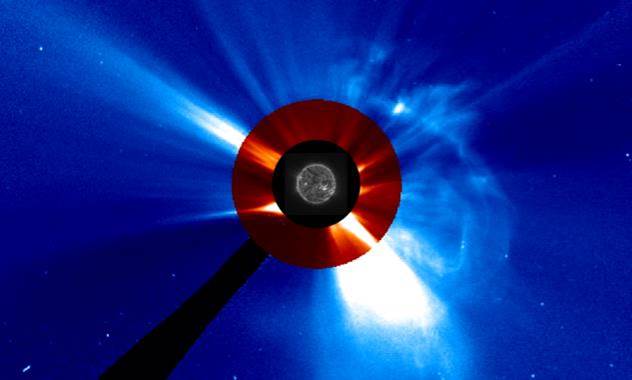
NOAA 2297 produced its strongest flare on 11 March. Peaking at 16:22UT, the X2.1 event lasted only for 18 minutes. At the time, NOAA 2297 was a very compact, but also very complex sunspot group displaying multiple delta structures, i.e. sunspots with opposite magnetic polarity within the same penumbra. A coronal mass ejection (CME) was associated with this flare, but, as can be seen in the extreme ultraviolet (EUV) picture underneath at 16:32UT, most of the material was ejected to the east (left) and not to the Earth.
However, the most interesting event in this region took place early on 15 March, when NOAA 2297 produced a long duration C9.1 flare peaking at 02:13UT. This relatively modest flare was accompanied by a mild proton enhancement. Most importantly, also an asymmetric partial halo CME was observed that had a plane of the sky speed of 700 km/s. Though the bulk of this CME seemed to be directed away from Earth, a glancing blow was expected. A movie on NOAA 2297's evolution, the C9 flare and the associated CME can be seen here.
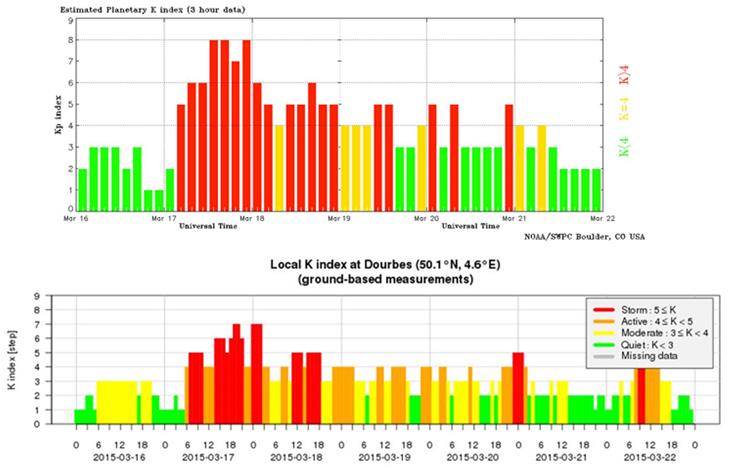
The ACE satellite observed a shock in the solar wind parameters shortly after 04:00UT on 17 March, which is only 50 hours after the flare. Solar wind speed jumped from 400 km/s to slightly above 500 km/s, then gradually increased over the next few hours to a maximum of nearly 700 km/s. Except for a brief interruption between 09:00 and 11:00UT, the vertical component of the interplanetary magnetic field was persistently southward at about -20 nT from around 05:00UT till 23:00UT. This resulted in a severe geomagnetic storm (Kp = 8; see Note 2) lasting most of the second half of 17 March. Also Dourbes recorded a strong (K = 7) geomagnetic storm.
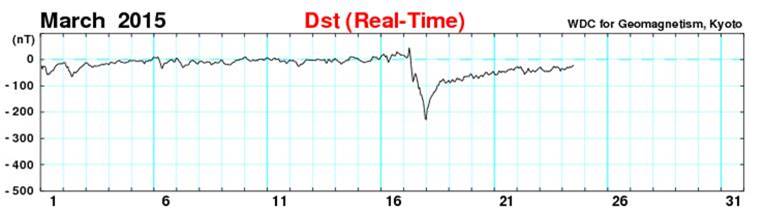
The evaluation of the strength of a geomagnetic storm is based on the Dst index, short for Disturbance storm time (see Note 3). It is expressed in nanoteslas (nT) and is based on the average value of the horizontal component of the Earth's magnetic field measured hourly at four near-equatorial geomagnetic observatories. Because it measures a depression of the horizontal component, the Dst index during geomagnetic storms is actually negative. Dst-values between -50 and -100nT are usually associated with moderate geomagnetic storms, and values of -100 nT or less with intense storms. So far this solar cycle, we only had a handful of such intense storms, with 25 October 2011 (-134nT), 17 March 2013 (-132nT), and 09 March 2012 (-131nT) as some well-known examples.
However, the 17 March 2015 storm really dwarfs these storms, as the provisional Dst-value for that day reached -228nT, making this by far the strongest geomagnetic storm so far during SC24. In fact, we have to go back all the way to 15 May 2005 (maximum Dst of -247nT) to find an even stronger geomagnetic storm. Nonetheless, to put things in perspective, during the very intense geomagnetic storms of 28-29 October 2003 and 13-14 March 1989 Dst-values of resp. -383nT and -589nT were recorded (source: Kyoto World Data Center)!
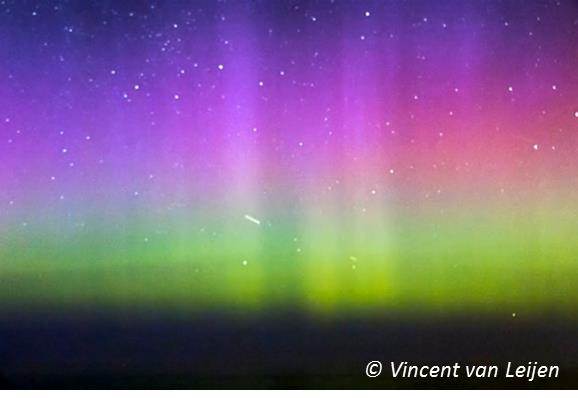
As could be expected from such strong storms, aurora were visible from countries well south of the usual polar light regions. So no surprise, but still quite rare, that polar lights were photographed and reported from France (Vosges, Picardy,...), Germany, the Czech Republic, and the middle of Russia. Underneath a screenshot from a movie made by Vincent van Leijen from the northern part of the Netherlands. There have also been some reports on issues with GPS signals and with (amateur) radio communication bands.
Note 1 - More info on the flare-abundant active region NOAA 1515 is in the news items from 6 July 2012 and 10 July 2012.
Note 2 - More info on the Kp-index is in this news item from 26 March 2014.
Note 3 - More info on the Dst index and data can be found at INGV, at NOAA, at the Kyoto WDC, and at SWRI/Image.
Credits - Imagery for the movie was taken from SDO, SOHO/LASCO, PROBA2 and (J)Helioviewer.
 |
 |
