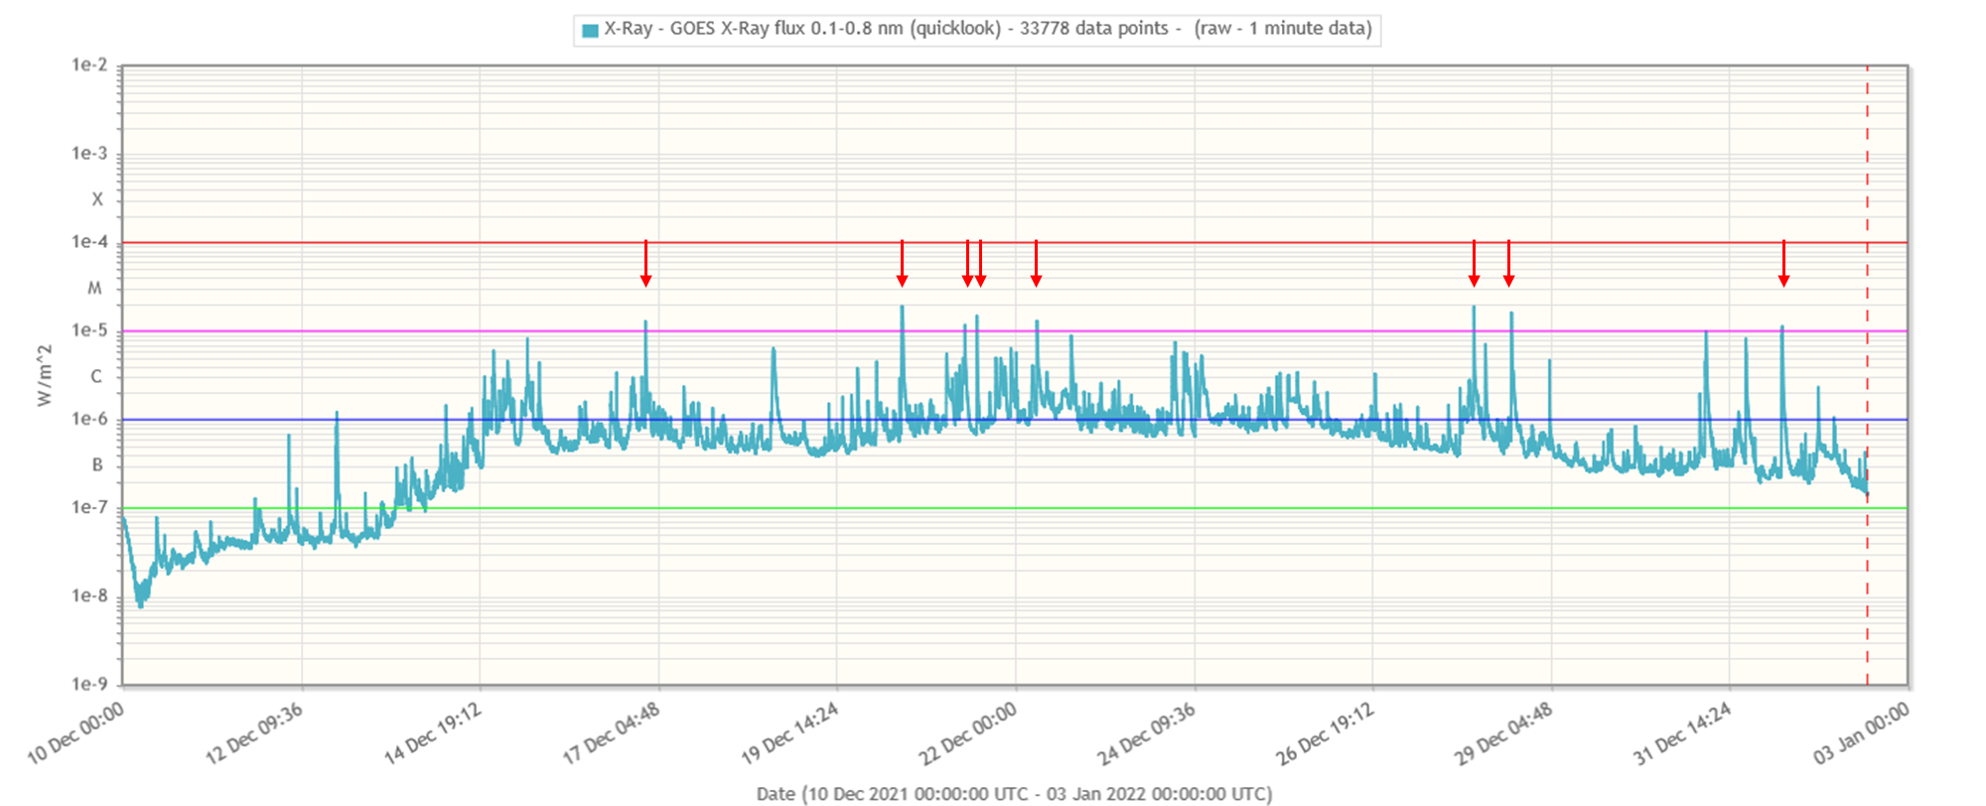
Coinciding with the enhanced sunspot activity of the last few weeks, the Sun also produced 8 M-class flares during this period. These were all low-level M-class flares, the strongest were M1.8 events on 20 and 28 December. The annotated graph underneath was produced with the STAFF tool and shows the x-ray flux as observed by GOES from 10 December until 2 January. The M1 flares are indicated by a red arrow.
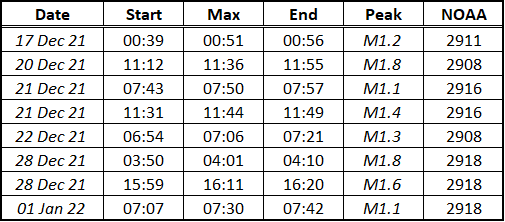
The table underneath provides some details on the M-class flares: the date, the timings of beginning, maximum and ending of the flare, the peak x-ray flux reached (GOES), and the NOAA number of the source region. None of these flares were impulsive (lasting less than 10 minutes) or long duration (lasting more than an hour) events.
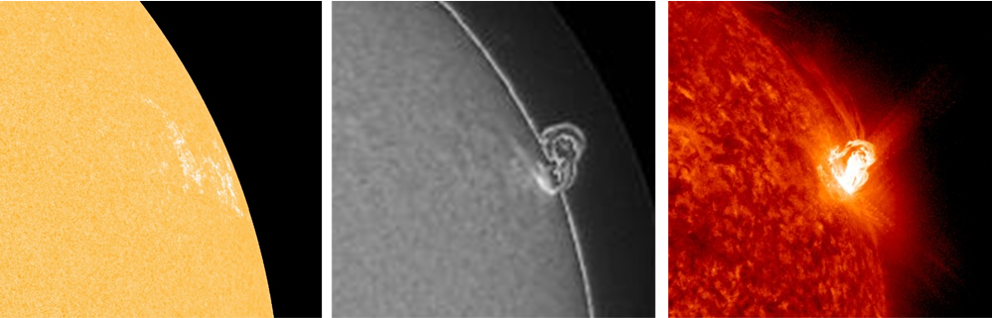
Of note is that the 2 M-class flares from NOAA 2916 were produced while this active region was still at the southeast limb, well before it started to grow in size and became the dominant sunspot region during the subsequent 2 weeks - when it only produced C-class events. It is also interesting to see that NOAA 2918 was virtually spotless when it produced the last of its 3 M-class flares. Underneath shows the region near the flare's peak time (1 January around 07:30UT) in white light, H-alpha (temperatures around 10.000 degrees) and in extreme ultraviolet (temperatures around 80.000 degrees), courtesy of respectively SDO/HMI, GONG/H-alpha, and SDO/AIA 304.