
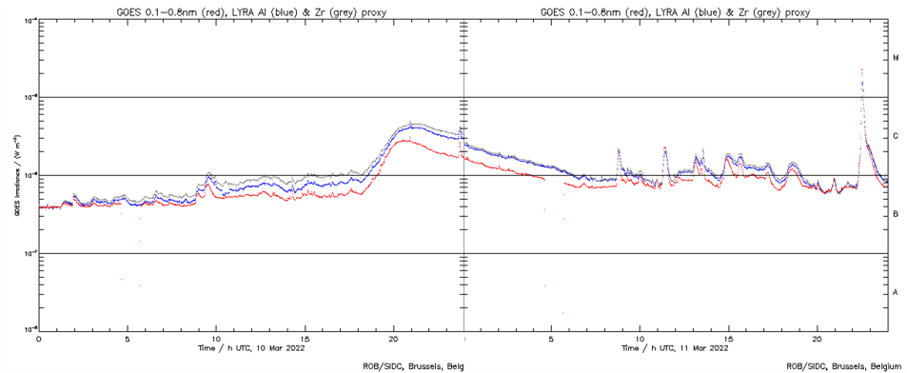
Late on 10 March, a long duration event took place in the nearly spotless region NOAA 2962. This sunspot group was near the Sun's central meridian and consisted of only a few tiny spots in the trailing portion of the region. The event started at 18:15UT, reached a peak of C2.8 at 20:33UT, and returned to preflare levels only around 07UT on 11 March. The graph underneath covers 10-11 March and shows measurements in ultraviolet (UV, grey and blue data) as obtained by the LYRA instrument onboard PROBA2 and in soft x-rays (SXR, red) as measured by GOES. The flare can be seen about halfway in the graph.
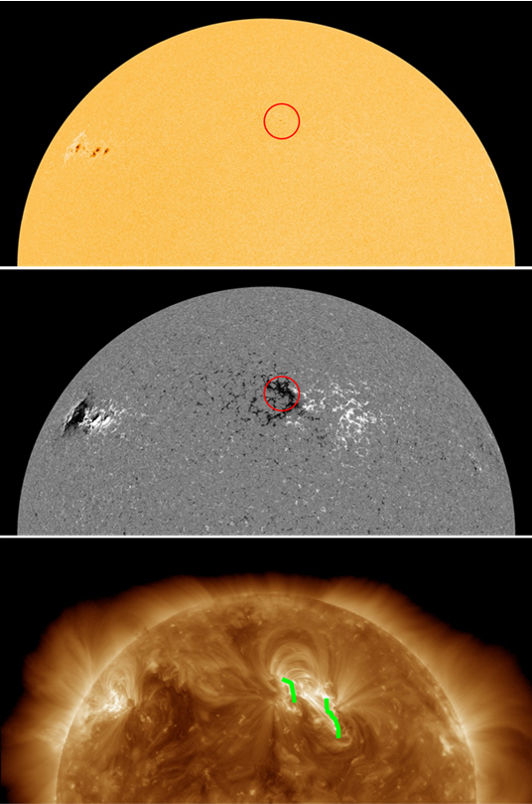
The event probably concerned the eruption of a filament (channel) located near the neutral line of the relatively large magnetic region. This can be seen in underneath annotated imagery taken by SDO instruments, showing the area in white light (top), the associated magnetogram (middle), and the view in extreme ultraviolet (EUV, bottom image). The images were taken about half an hour after the timing of the SXR peak. One can see the few puny sunspots from NOAA 2962 (white light, within red circle) in the trailing portion of the region with negative polarity magnetic fields (black in magnetogram, field lines returning to the Sun). There are some positive magnetic polarity patches (white, field lines leaving the Sun) close to the negative polarity, so it is possible that interactions between these locations may have triggered the eruption. The EUV image (SDO/AIA 193) shows that the post-eruption coronal loops are rooted in the opposite polarity fields (annotated green ribbons) and overspan the neutral line.
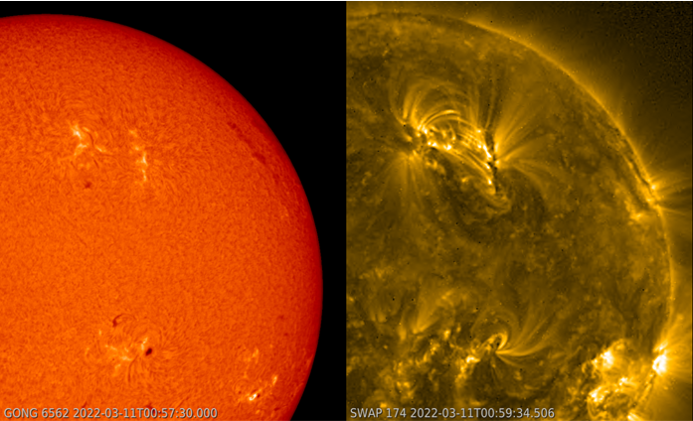
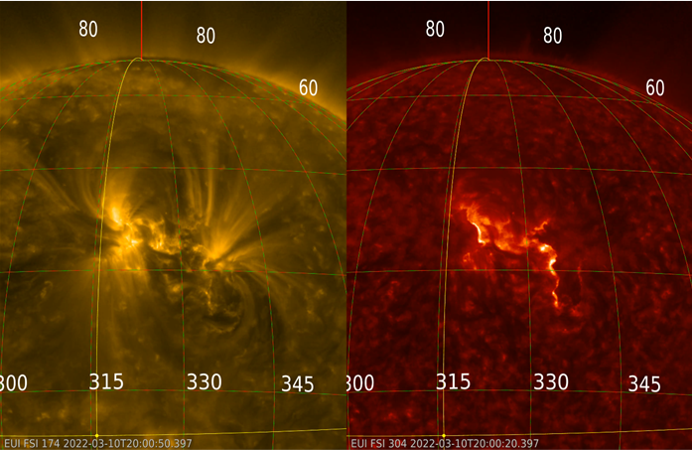
Underneath some additional imagery covering the eruption. A comparison of PROBA2/SWAP (17.4 nm) with ground-based H-alpha images (656.28 nm, in the red portion of the visible solar spectrum), is followed by a comparison in different wavelengths as observed by Solar Orbiter (Full Sun Imager) at 17.4 nm and 30.4 nm. The timing of the still images is respectively around 01UT on 11 March, and around 20UT on 10 March. The flare ribbons are better visible in the "colder" temperatures (H-alpha, FSI304 ; temperatures of resp. 10.000 and 80.000 degrees), whereas the coronal loops are better visible at higher temperatures (FSI174, PROBA2/SWAP 174, temperatures around 1 million degrees).
Credits movie: the SolO/EUI team (https://wwwbis.sidc.be/EUI/intro )
The coronal mass ejection (CME) associated with the eruption was a partial halo and had an earth-directed component. Underneath are coronagraphic images from this CME as observed by SOHO/LASCO and STEREO-A/COR2. The arrival of this interplanetary CME resulted in a moderate geomagnetic storm (Kp = 6) on 13 and 14 March. Interestingly, also last year we had a (minor) geomagnetic storm at the same days. This STCE news item provides a comparison between the 2021 storm and the notorious 1989 storm.
