
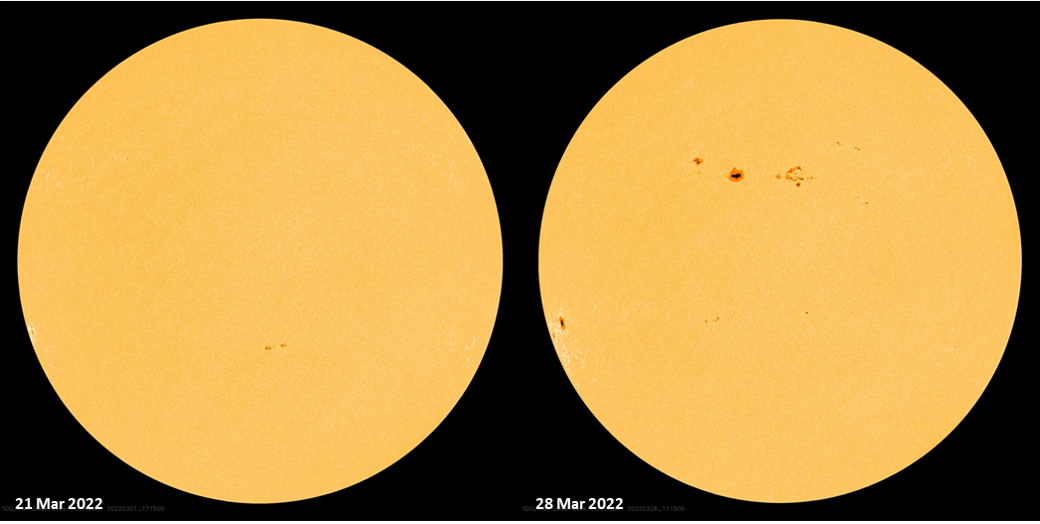
What a difference a week makes! Around the start of spring, sunspot groups were small and few. Barely a week later, sunspot groups are everywhere, rather large, complex, and flare productive. SDO/HMI images show only 3 small sunspot regions on 21 March, but no less than 9 on 28 March, driving the preliminary sunspot numbers from around 40 all the way up to 130 (SILSO). The difference can be seen in the HMI images underneath. Note also the presence of numerous small and inactive groups.
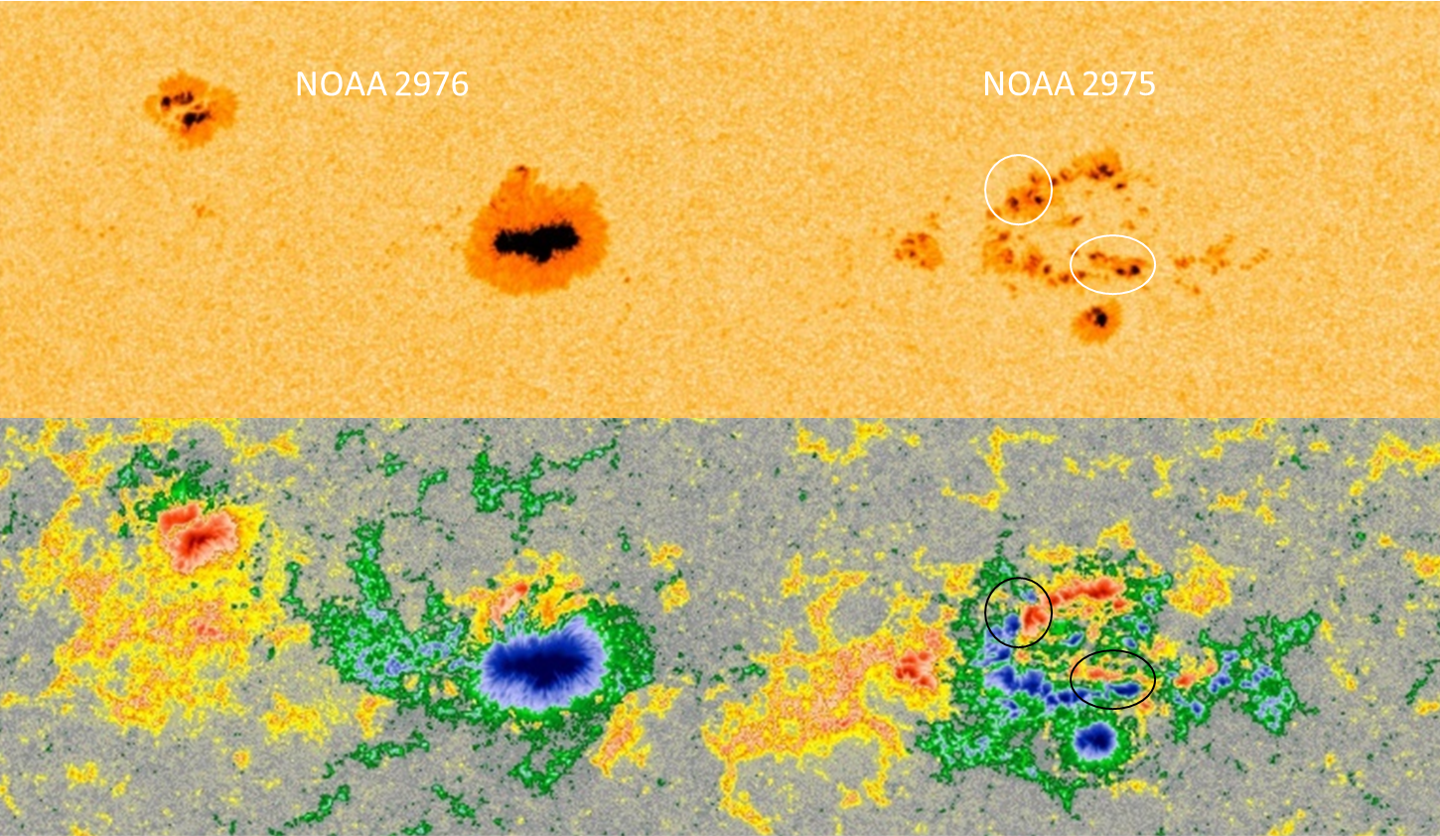
The two largest regions were NOAA 2976 and NOAA 2978, but they had a fairly open sunspot distribution and a magnetically simple configuration. NOAA 2975, which developed on 27-28 March, was smaller but growing and clearly had a much more complex magnetic structure than the 2 other regions. More importantly, it contained several delta spots, i.e. there's at least one mature spot present in which umbrae of opposite polarities are separated by less than 2° and situated within the common penumbra (see the STCE's SWx classification page). These delta spots are known for their potential to trigger many and strong solar flares. The SDO images underneath were taken at 11UT on 28 March, with white light on top and the magnetogram below it. Blue and red denote opposite magnetic polarity (resp. "positive" and "negative"). At least 2 delta spots are clearly visible in NOAA 2975, which is the right-most sunspot group. Can you spot them? (answer)

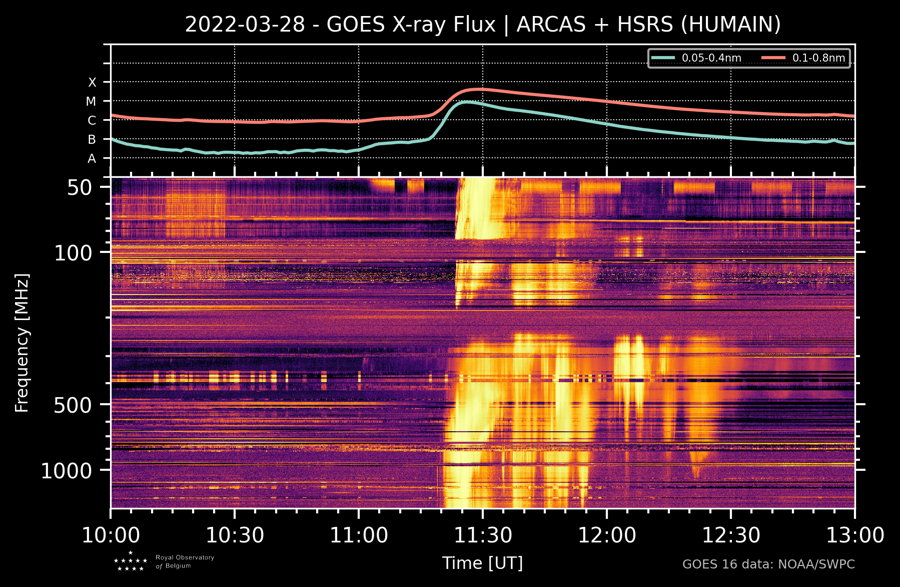
So it was not much of a surprize when NOAA 2975 started to produce M-class flares, with the strongest so far an M4.0 peaking at 11:29UT on 28 March. Imagery in extreme ultraviolet (EUV) by SDO/AIA showed an important coronal dimming near the source region (a temporary darkening in the solar corona, also somewhat confusingly known as "transient coronal hole") as well as a coronal wave (see this STCE news item for more info). Solar Demon captured both features very nicely in SDO/AIA's EUV difference images (one image subtracted from the next). They are strong indicators that a coronal mass ejection (CME) was associated with this eruption.

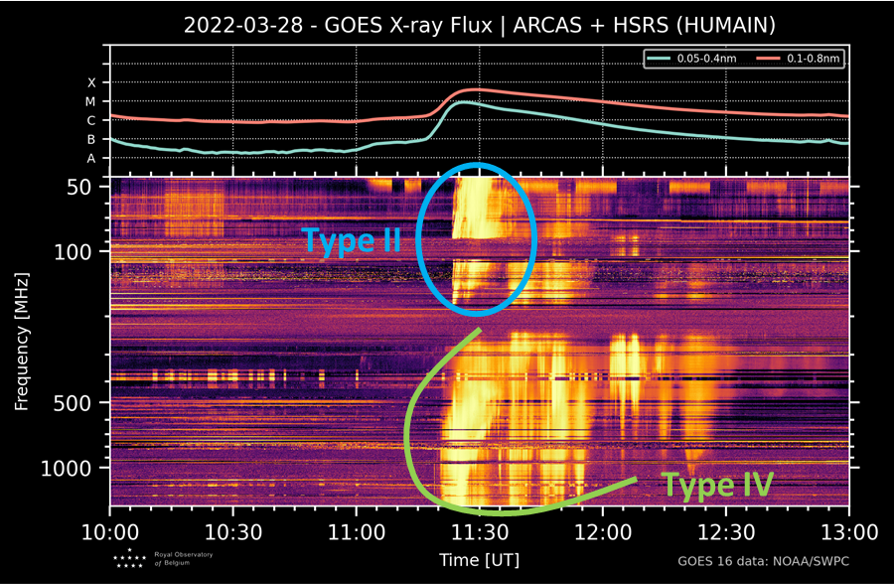
Also radio telescopes of the Humain Radioastronomy Station recorded the eruption in frequencies between 45 and 1495 MHz. Scanning continuously the intensity at these frequencies, disturbances can be discerned which are in this case associated with a CME-driven shock (Type II) and electrons trapped in closed field lines in the post–flare coronal loops produced by flares (Type IV) - See this annotated image and the STCE's SWx classification page for more examples and info on Type II, Type IV and other radio bursts. Note that shock speeds deduced from Type II radio bursts are rarely used in CME arrival calculations, as we usually don't know from which part of the CME/shock the emission is coming. Type IV bursts are strongly correlated with proton events, and indeed a small proton event was observed (18 pfu at 14:50UT on 28 March).
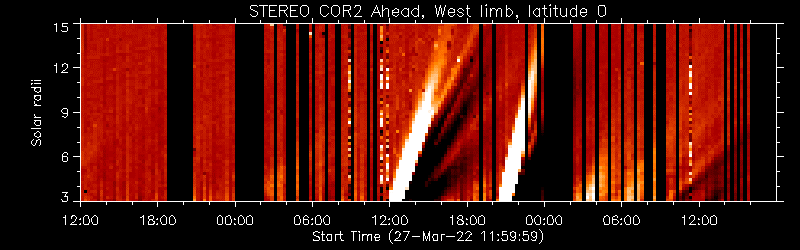
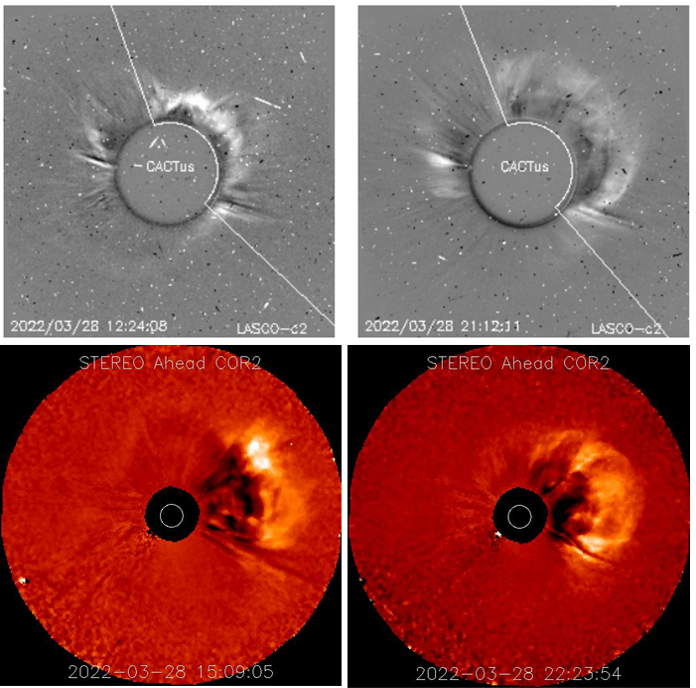
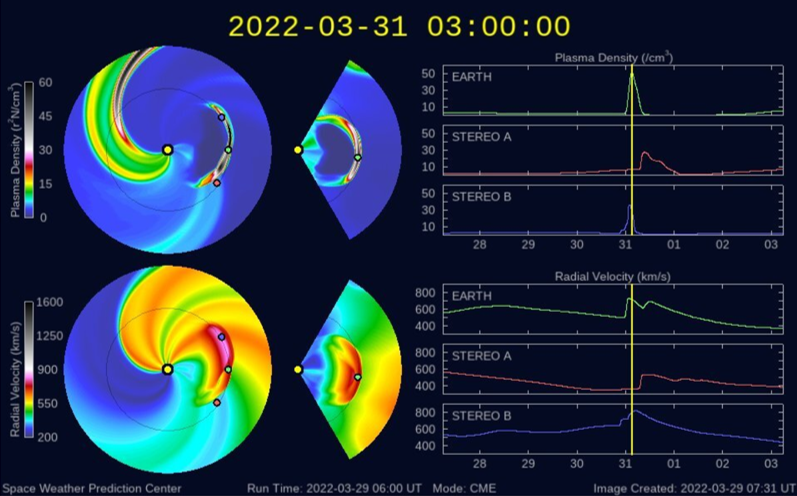
The CME associated with this flare was observed by coronagraphs on board SOHO and STEREO-A and seemed to be directed squarely at Earth. About 8 hours after the first CME, a second CME was observed which was related to an M1 flare from the same active region. Also this CME was directed towards Earth (compilation), but more importantly, it had a speed significantly higher than the first one. This can be seen in the time-elongation plots built up from STEREO-A COR2 coronagraphic running difference images, known colloquially by some as "J-plots". The CMEs are seen as diagonal bright and dark bands running from lower-left to upper-right (the vertical black bars are data gaps). The steepness of the band reflects the speed of the CME, which in this case is a bit steeper for the 2nd CME. So, this results in (plane-of-the-sky) speeds of resp. 500 and 670 km/s, and true speeds of the CMEs resp. around 650 and 870 km/s. Hence, it is very likely that this second CME will catch up with the first CME, to impact the earth environment on 31 March (WSA-ENLIL - image). This "CME cannibalism" is a mechanism known to produce stronger geomagnetic storms than any of the two CMEs individually, so this one will be worth watching as a strong storm (Kp=7) may be possible.

