UPDATE 1 January 2025 at 19:15UTC - A severe geomagnetic storm is currently in progress (Kp = 8o during the 15-18 UTC interval). KBEL reached moderate storming levels during the same timeframe. The Dst index reached preliminary values of -215 nT on 1 January during the 16-17 UTC interval (WDC Kyoto). From 17:00 UTC onwards, Bz has returned to much smaller values near 0 nT (DSCOVR). From these data, and barring any new arrivals of other interplanetary CMEs, it is expected that the geomagnetic storm will gradually calm down. Weather permitting, there's still a chance to photograph aurora from Belgium in the coming hours.

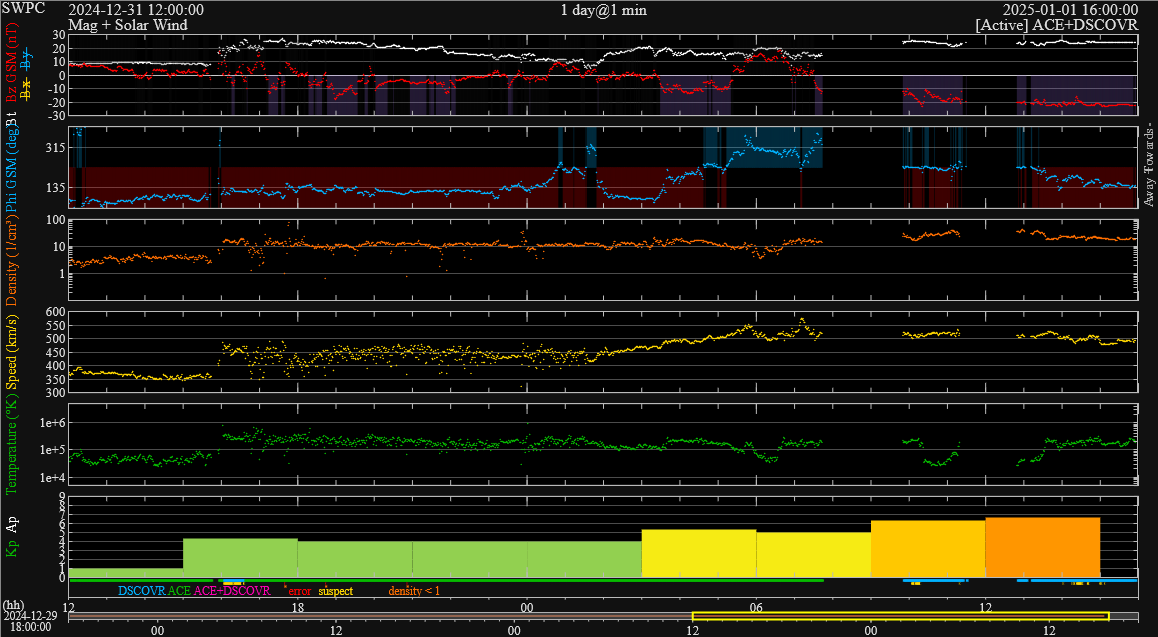
UPDATE 1 January 2025 at 16:45UTC - Strong geomagnetic storm conditions (NOAA Kp = 7) have been reached during the 12-15 UTC interval on 1 January. This is due to the arrival of the observed halo coronal mass ejection (CME) from the morning of 29 December. A shock was observed on 31 December around 15:50UTC (DSCOVR; data gap), with solar wind speed (yellow curve) jumping from 350 km/s to 450 km/s, and the strength of the interplanetary magnetic field (IMF ; white curve) rising from 8 to 27 nT (17:36 UTC on 31 December). The intensity of the north-south component of the IMF (Bz; red curve) was moderately negative, hovering around -10 nT and briefly dipping to -18 nT at 18:59 UTC. At that time, only active geomagnetic conditions (Kp = 4) were observed.
An enhancement in the solar wind was observed starting on 1 January at 01:50UTC. Solar wind speed gradually (no shock) increased from 420 to 550 km/s. Bz undulated between -13 and +18 nT, before diving to sustained values around -20 nT from around 09 UTC onwards, with largest values of -23 nT. Minor geomagnetic storming was observed during the 03-06 and 06-09 UTC intervals, then increasing to strong geomagnetic storming (Kp = 7-) during the 12-15 UTC interval. KBEL reached moderate storming levels during the 11-14UTC interval. The preliminary Dst index reached impressive values around -205 nT on 1 January (WDC Kyoto), bringing it into the Top 5 of strongest storms so far this solar cycle (SC25).
Long exposure photographs show red aurora as far south as northern Italy in Europe, and Arizona in the United States (Spaceweather.com). If the geomagnetic activity continues at moderate to strong storming levels, and weather permitting, there's a chance to photograph aurora also tonight from Belgium.
It is at present unclear if the enhanced solar wind conditions are from the first CME or already a manifestation of the second CME that was expected to arrive on 1 January. Further periods of moderate to strong geomagnetic storming are likely over the next day due to the ongoing CME effects and the forecasted arrival of a second CME from 29 December (SIDC).

UPDATE 30 December 2024 at 15:30UTC - The SIDC forecaster has assessed the available coronographic imagery (PRESTO): "The halo Coronal Mass Ejection (CME) reported yesterday, seen in SOHO/LASCO-C2 data from 06:12 UTC December 29 has been further analysed. It is likely associated with the M2 flare (SIDC flare 3113) at 04:30 UTC December 29 from SIDC Sunspot Group 351 (NOAA AR 3939). An eruption and dimming can be seen in the south-east of the solar disk seen in GOES/SUVI images around 05:00 UTC. This CME is deemed to be earth-directed with an estimated arrival time of late on December 31.
A second faint partial halo CME directed to the east was also observed in SOHO/LASCO-C2 data from 18:12 UTC on December 29, associated with a on disk dimming and eruption visible in the south-east quadrant also near SIDC Sunspot Group 351 (NOAA AR 3939) in SUVI imagery around 16:40 UTC. Although faint and difficult to estimate the speed this CME, it is also determined to be earth-directed with an estimated arrival on January 01."
Geomagnetic conditions are expected to range from unsettled to respectively moderate and minor storming, i.e. Kp = 3 to resp. Kp = 6 and Kp = 5. The CMEs that may be associated to today's flaring activity required some additional images and analysis. The clip underneath shows coronagraphic imagery (SOHO/LASCO C3) from 29 until 30/09:30UTC December.

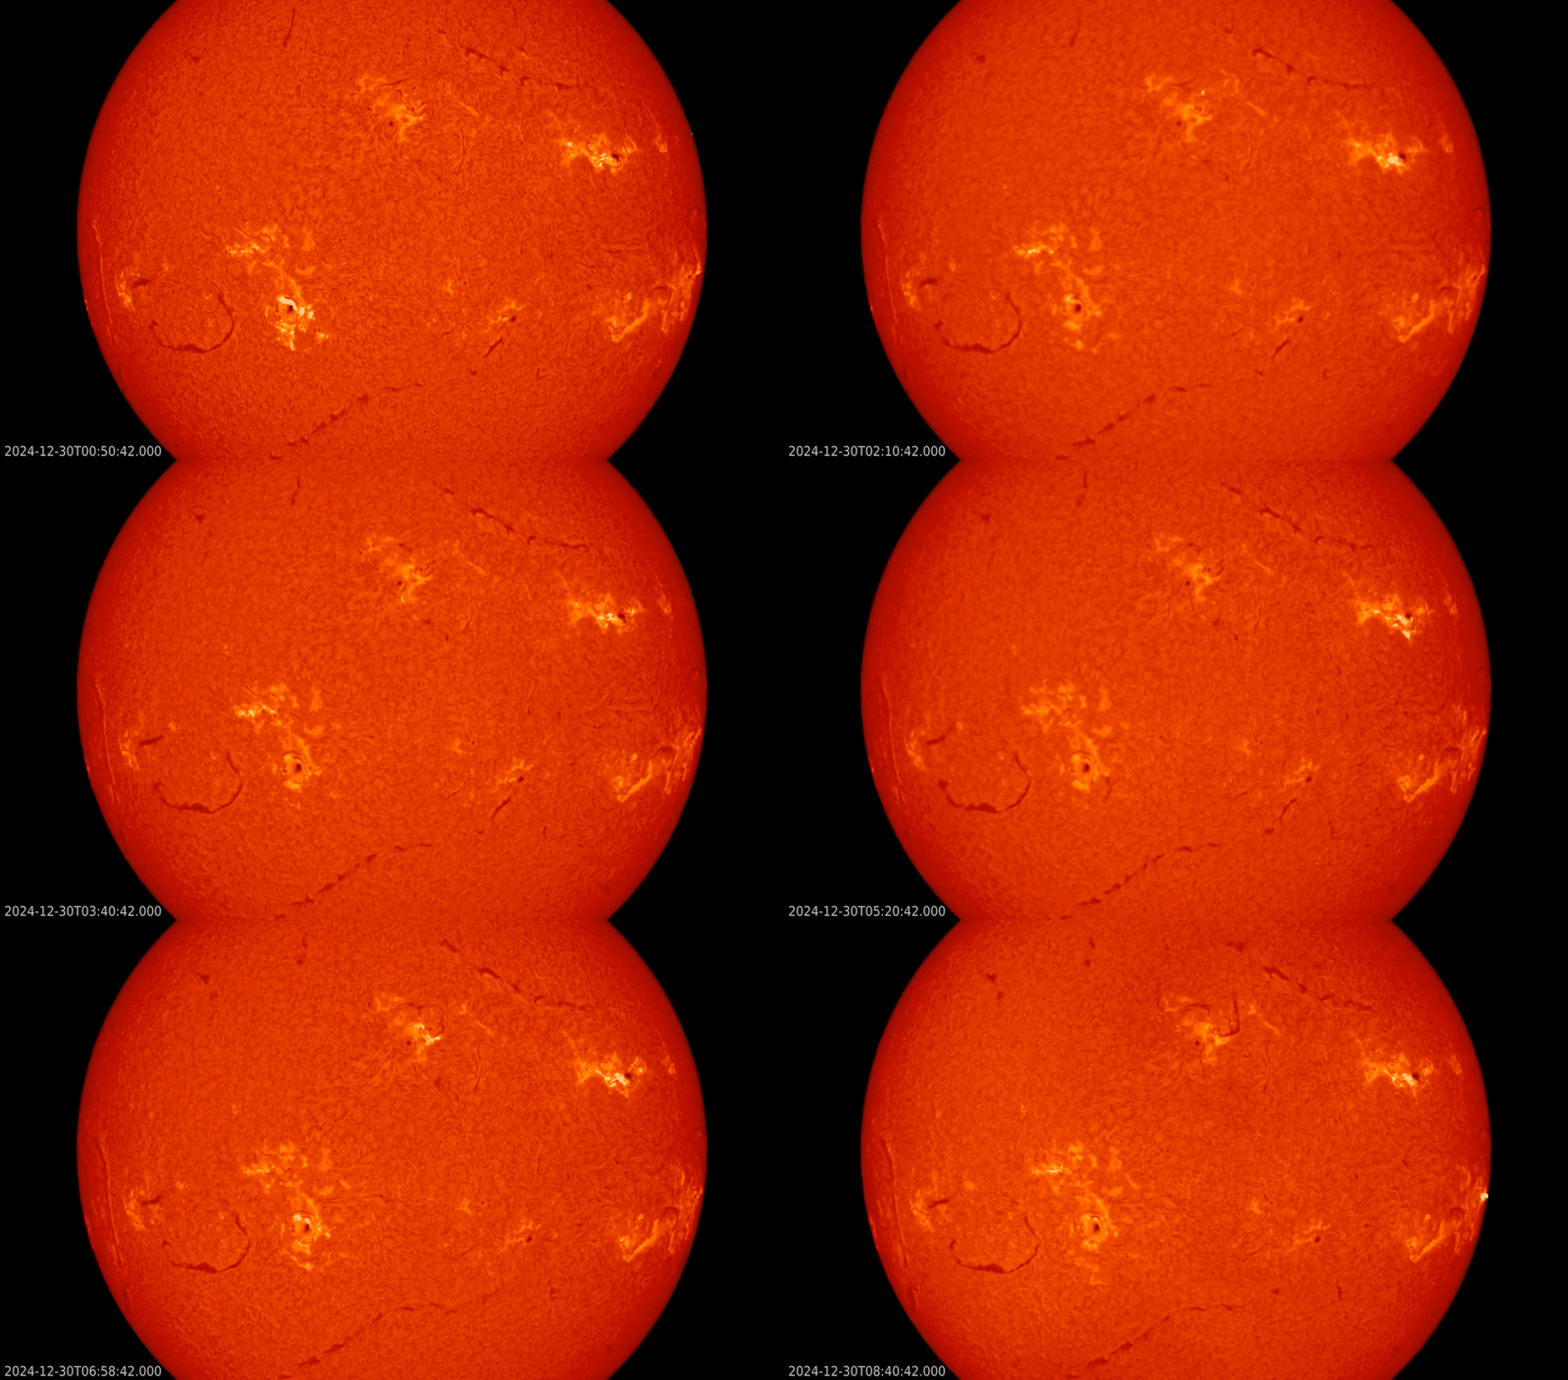
UPDATE 30 December 2024 at 10:00UTC - Solar flare activity is high with about 20 M- and 3 X-class flares over the last 24 hours, from several regions. NOAA 3936 was the main source of the flaring activity, and also the source of another X-class flare: The X1.5 event peaked at 04:14UTC on 30 December (GOES). It triggered an eruption in nearby NOAA 3932 which drove the soft x-ray flux back above the X1-level. This second X-class flare reached an intensity of X1.1 and peaked at 14:31UTC. This can be seen in this graph, as well as in the clip underneath showing the flaring activity in H-alpha (a line in the red portion of the solar spectrum) early on 30 December (GONG). A Moreton wave can be seen moving from NOAA 3936 to the west and southwest (see also this STCE newsitem). A Moreton wave is thought to be the chromospheric counterpart of the coronal wave (also known as EUV wave or EIT wave; see this STCE newsitem), which may be indicative of a coronal mass ejection (CME). Standing-by for further analysis by the SIDC forecaster. Further M- and X-class flare activity can be expected from NOAA 3936 and other sunspot regions currently on the solar disk.
The greater than 10 MeV proton flux remained slightly enhanced (from a previous event) above background levels, well below the alert threshold of 10 pfu. The X-class flares affected the lower frequency portion of the High Frequency communication band (HF Com ; 3-30 MHz) mainly over the Australia, South-East Asia, and the eastern portion of the Indian Ocean (see this D-RAP map from NOAA/SWPC). Advisories to civil aviation have been issued (PECASUS).

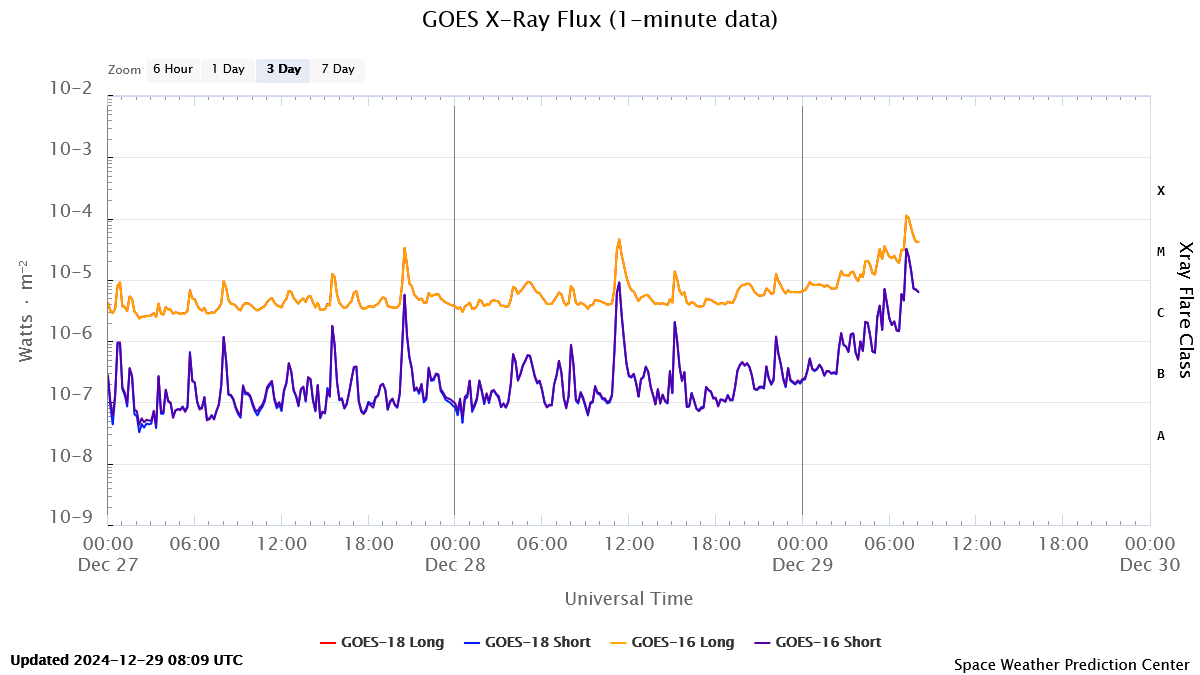
ORIGINAL 29 December 2024 - NOAA 3936, the largest sunspot region currently on the solar disk, was the source of an X1.1 flare that peaked on 29 December at 07:18UTC. This X-class flare is as yet the culminating point of increased flaring activity that started on 28 December around 18h UTC. NOAA 3936 has been seen by the naked eye (using eclipse glasses), and the big leading spot harbors a magnetic delta structure. The graph underneatn shows the evolution of the soft x-ray flux as observed by GOES. The imagery shows the Sun in white light (GONG) and in extreme ultraviolet (GOES/SUVI 131). The X-class event is obvious, as shown in this still. Further X-class flaring is possible.


The greater than 10 MeV proton flux remained slightly enhanced (from a previous event) above background levels, well below the alert threshold of 10 pfu. There are currently no reports of a Type II radio burst, and there are no coronographic imagery yet that may indicate any associated coronal mass ejection. Standing-by for coronagraphic images and further analysis by the SIDC forecaster. The X-class flare affected the lower frequency portion of the High Frequency communication band (HF Com ; 3-30 MHz) mainly over the Indian Ocean, Madagascar and Western-Australia. This can be seen on the D-RAP map underneath (NOAA/SWPC). An advisory to civil aviation has been issued (PECASUS).


