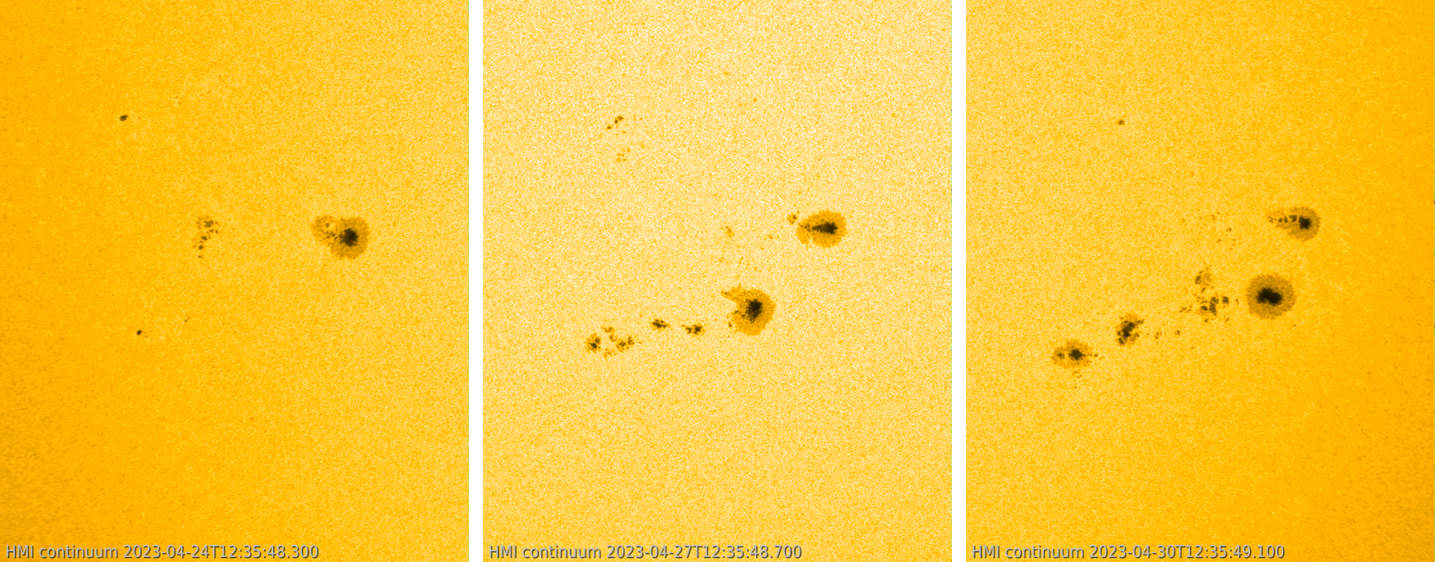
On 24 April, active region NOAA 3288 started to develop to the south-east of another fairly simple sunspot region, NOAA 3285. The first 3 days consisted mainly in maturing of the main spots, and the region remained fairly flare passive with only 2 minor C-class flares during this period. The images underneath (SDO/HMI) show the Sun in white light on 24, 27 and 30 April, with a clip covering the period from 24 April till early 02 May Note how, in just a few days, the region develops from nothingness to a sunspot group that has a surface area more than twice the total area of the Earth. Also, the leading portion of the group gradually moves to the nearby active region NOAA 3285. A full sun disk clip is here.


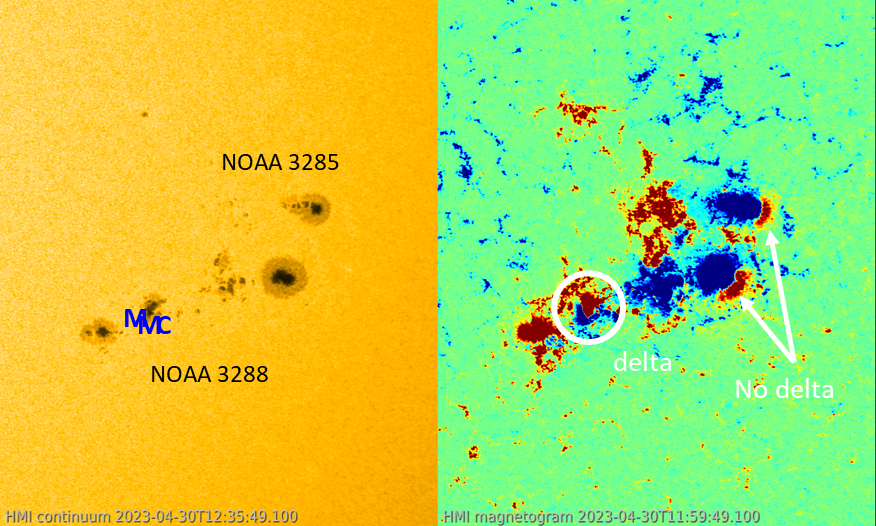
Then, late on 26 April, the middle portion of the sunspot group started to develop delta magnetic configurations. "Delta" is part of the Mount Wilson magnetic classification of sunspot groups. It is a suffix that can be appended to 3 of the 4 classes if the sunspot group contains at least one mature spot in which umbrae of opposite polarities are separated by less than 2 degrees and situated within the common penumbra. Delta regions have a much higher flaring probability than the other sunspot regions. More info on this classification scheme and examples can be found at the STCE's Space Weather Classification webpage.


In the imagery above, the left image shows the sunspot groups NOAA 3285 / NOAA 3288 in white light, whereas the right image reflects the magnetic configuration with red colours for the positive magnetic polarity (field lines coming out of the solar surface), and blue for the negative magnetic polarity (field lines returning towards the solar surface). It shows the approximate locations of the C7, M1 and M7 flares that were produced by NOAA 3288 on 30 April and 01 May, superimposed on imagery of 30 April. They all originated from the delta-complex in the trailing portion of NOAA 3288, as can be seen in the annotated magnetogram. Note that the red colour in front (to the west) of the leading main sunspots of NOAA 3285 and 3288 is a line-of-sight effect due to the proximity of the groups to the solar limb, and so they do not constitute delta spots - See this STCE newsitem for more info.

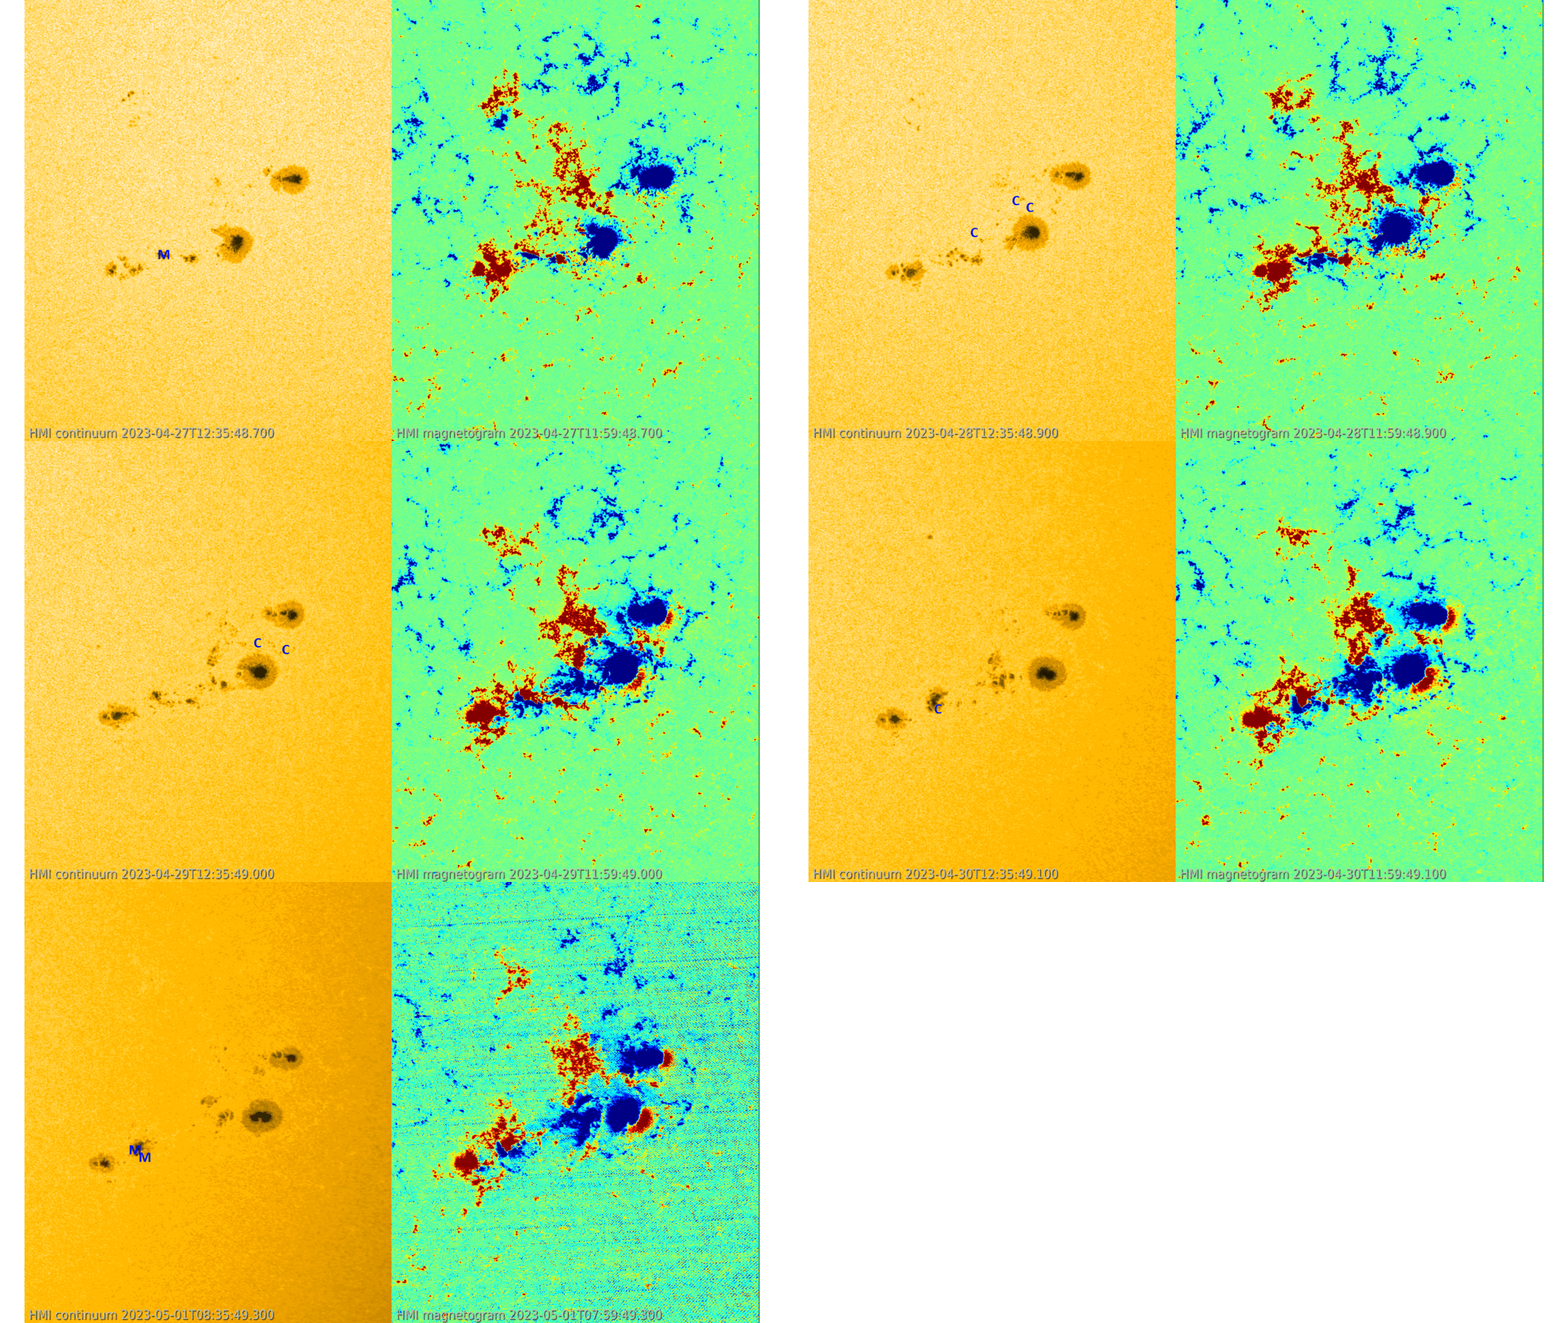
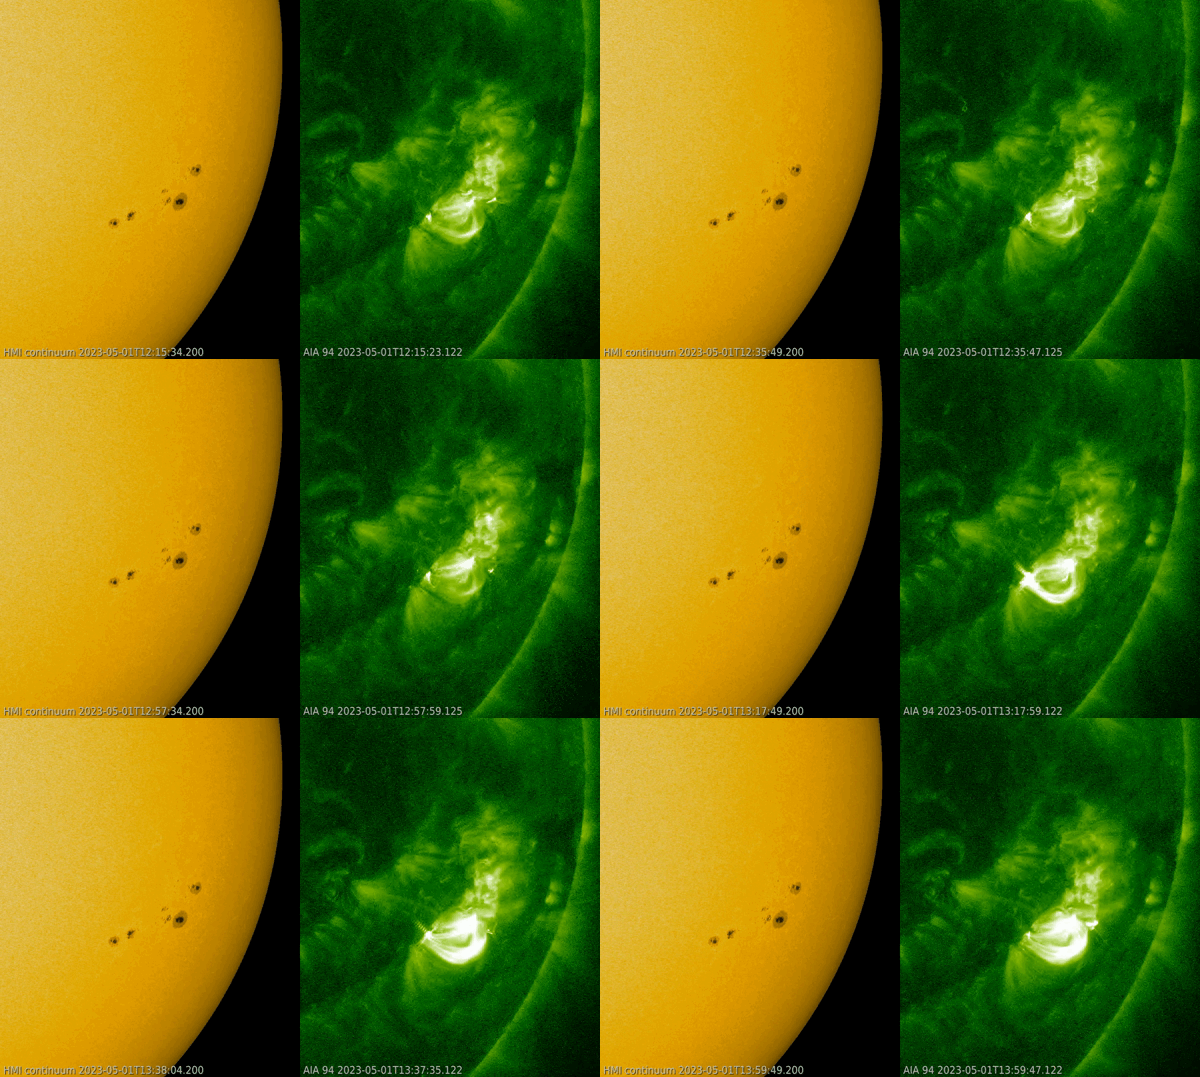
The clip above is covering the period 27 April - 1 May (1 day cadence), with for each day the approximate location of every C5 or stronger flare produced by the NOAA 3285/3288 duo. The 3 M-class flares produced by NOAA 3288 all originated from the delta spots, but many of its C5+ flares seem to originate from the interaction between the leading portion of NOAA 3288 with the trailing portion of NOAA 3285, as well as with some opposite polarity magnetic flux that is present to the south of NOAA 3285's main spot. Whereas NOAA 3288 produced only 2 small C-class flares between 24 and 26 April, the combined effect of delta spots and magnetic interaction resulted in a total of 32 C-class flares (6 C5 or stronger) and 3 M-class flares during the 5 subsequent days (NOAA/SWPC data). Underneath on the left is a white light image and on the right an extreme ultraviolet (EUV) image (SDO/AIA 094) of NOAA 3288 showing the M7.1 flare near its peak at 13:09UTC on 1 May. The blooming and diffraction patterns in the EUV images are image artefacts, not related to the flare - See this STCE newsitem for more info.


