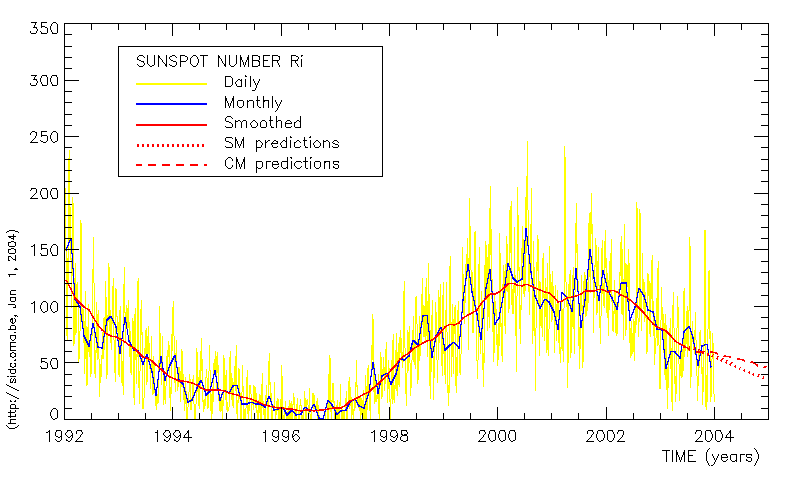
A few days in the months October and November 2003, the daily sunspot number was tremendously high. This seems unusual since we are in the declining phase of the solar cycle.
The sunspot number is the oldest solar index measuring the solar activity. This number was already measured on a regular basis since Galileo Galilei pointed his telescope at the Sun in 1610. Even before that time, one can find observations done with the naked eye from 165 BC to AD 1684. This explains why the Sunspot Number as a solar activity index is really valuable to the international scientific community.
The sunspot number is calculated by counting the number of sunspot groups and the number of individual sunspots. The "sunspot number" is then given by the sum of the number of individual sunspots and ten times the number of groups. Since most sunspot groups have, on average, about ten spots, this formula for counting sunspots gives reliable numbers even when the observing conditions are less than ideal and small spots are hard to see.
In the picture underneath, different sunspot numbers are plotted. Different in the sense that the yellow line presents a daily number, while the blue line is the monthly averaged index. The full red line is the yellow or blue line but smoothed, so that the peaks are left out. You can read more about this at the pages about the SIDC.

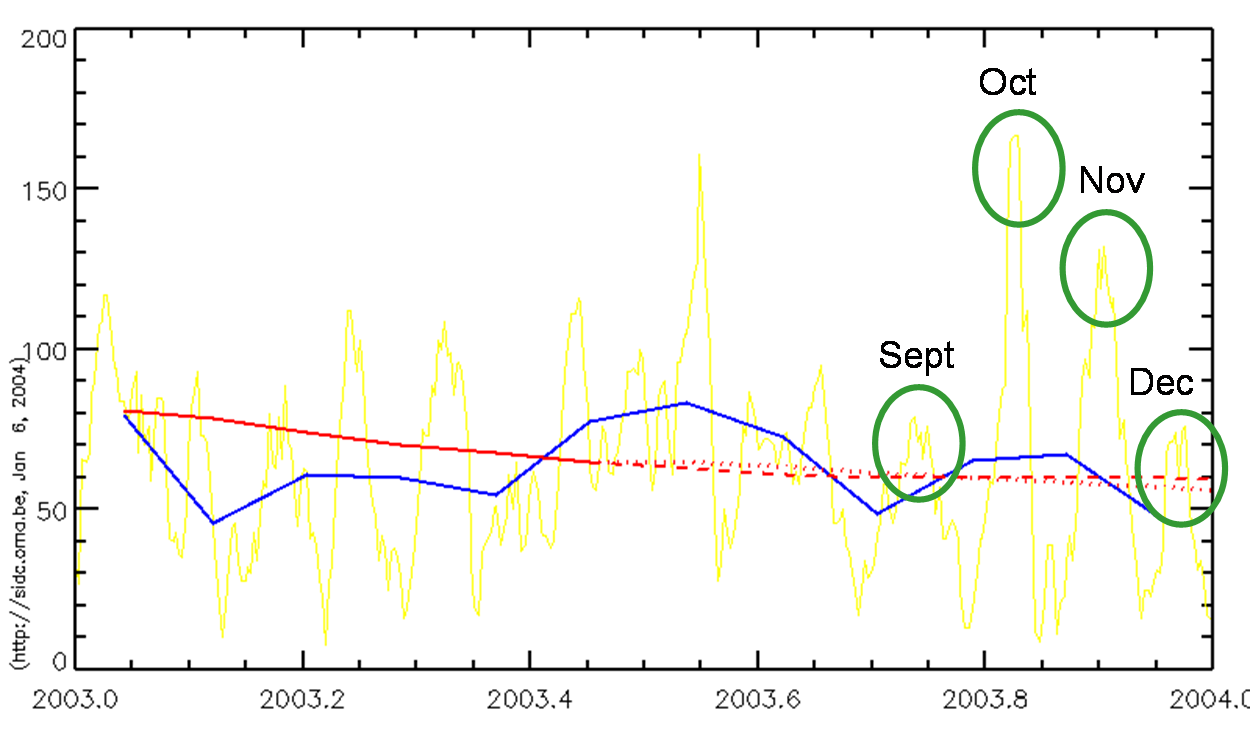
Let's have a closer look. In the figure underneath, we enlarged the last part of the graph above. In the yellow line we can easily detect a recursive pattern. The peak in the first green circle coincides in time with end September 2003. On September 27, a sunspot number of 79 was recorded. Almost one month later, at the October peak, a maximum value of the sunspot number of 167 on October 29 and 30 was measured. As we can remember, this was the time that the Sun became a television star. In every news program, news paper, the Sun was pointed at as the source of radio-disturbances, satellite disruptions, GPS disturbances,... One month later, the peak with number 132 occurred on November 27. The December 23 peak of 76 was comparable with the September peak. This recursive behaviour finds its origin in the solar rotation: the Sun rotates around its own axis in about 27 days.

In the yellow curve, we detect the clear peaks. However, these peaks do not disturb the global view of the 11-year solar cycle. During the month June, the Sun adorned itself also with a whole bunch of sunspots producing several X-class flares. The flares were not so energetic compared to the ones of October and did not cause so much fuzz. Even stronger, the blue line representing the monthly sunspot number has an even higher bulb in June compared with the bulb of October 2003.
To conclude: it's not because we have a cold summer day, that the summer season is not summer any more. So, we can heave a sigh of relief: the Sun did not lose track and will continue its route on the 11-year cycle.


