news
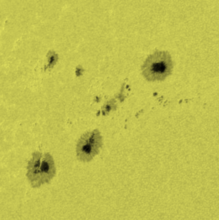
Submitted on 2015-05-27Last week, the sunspot activity was again all but exciting. Only a few, very small, and mostly inactive sunspot groups were visible in white light. In H-alpha, which is a filter showing the "cold" inner atmosphere of the Sun, the Sun's outlook was dominated by some long filaments. These are local belts of plasma squeezed together by opposite polarity magnetic fields (see last week's newsletter). Moving up to the hot outer solar atmosphere, the extreme ultraviolet (EUV) imagery from SDO showed darkish patches.
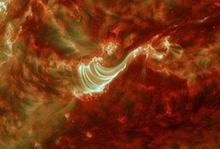
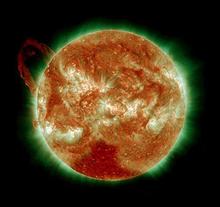
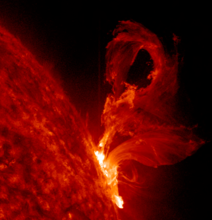
Submitted on 2015-05-20Some very nice prominence and filament eruptions were observed over the last week. In this MOVIE, four major events are shown in the combined filters of SDO's AIA 304 ("cool"; about 80.000 degrees; red) and AIA 193 ("hot"; about 1.3 million degrees; green). Prominences and filaments usually lay dormant until the surrounding magnetic fields become unstable and eject the material into space.
Submitted on 2015-05-06The STEREO spacecraft are still in safe mode as they go through their superior conjunction, passing behind the Sun as seen from Earth. This means that for an extended period of time, we cannot receive any imagery from the far-side of the Sun due to radio interference from the Sun. See the STEREO-website for up-to-date information.

Submitted on 2015-04-30
Squeezed between magnetic fields of opposite polarity, a really big blob of plasma (charged particles) rounded the Sun's northeast limb. The prominence offered impressive sights in H-alpha filters, which are suited to observe the inner, "cold" (10.000 degrees) atmosphere of the Sun.

Submitted on 2015-04-15
At the end of a rather dull week, a cluster of sunspots appeared from behind the northeast limb. The active region was numbered NOAA 2321, had a sunspot area of about 4 times the surface area of the Earth, and produced an M1 flare on 12 April.

Submitted on 2015-04-09
In absence of any large or complex sunspot group, this week's main event was another spectacular filament eruption. This eruption took place late on 4 April and was associated with a long duration C3.8 double ribbon flare that started at 22:16UT, peaked at 00:07UT, and ended at 01:45UT. "Double ribbon" here means that there are two bright ribbons parallel and along the location of the ejected filament.

Submitted on 2015-04-02
Around noon on 27 March, a giant wall of solar plasma (charged particles) propelled itself into space. A movie of this event can be seen here.

Submitted on 2015-03-26
Over the last 2 weeks, solar activity was dominated by the small but complex sunspot group NOAA 2297. Under its dictatorship, no less than 97 "common" C-class flares, 23 "medium" M-class flares and 1 "extreme" X-class flare were produced. This makes it one of the most flare productive groups of the current solar cycle so far, very comparable to e.g. NOAA 1515 from July 2012 (see Note 1).

Submitted on 2015-03-12
Though the Sun was devoid of big sunspot groups this week, no less than 9 M-class flares were recorded. These medium flares were produced by only 2 active regions: NOAA 2290 (5) and NOAA 2297. Interestingly, both regions were at the solar limb when they unleashed their flares. In fact, the last two (and strongest) M-class events of NOAA 2290 were produced when the region had already rounded the northwest solar limb, whereas NOAA 2297 had already released 2 of its 4 M-class events before it rounded the southeast limb.
Submitted on 2015-03-05
On February 24, 2015, around 10:00UT, the Sun put on quite a show with a gorgeous filament eruption. PROBA2 was on the outlook, and its EUV camera (SWAP) recorded a magnificent movie of the event.

Pages
Zircon - This is a contributing Drupal Theme
Design by
WeebPal.


