news
Submitted on 2015-12-02
On 02 December 2015, the Solar and Heliospheric Observatory (SOHO) will celebrate its 20th birthday. Since its launch in 1995, this versatile spacecraft has become an icon in solar and heliospheric research, and has provided space weather forecasters a solid base to build on.
Submitted on 2015-11-17
Solar filaments are clouds of charged particles ("plasma") above the solar surface squeezed between magnetic regions of opposite polarity. Being cooler and denser than the plasma underneath and their surroundings, they appear as dark lines when seen on the solar disk and as bright blobs when seen near the solar limb (then they are called "prominences"). Special filters are required to observe these features, and one such a filter is the Hydrogen-alpha (H-alpha) line in the red part of the solar spectrum.
Submitted on 2015-11-11Although we are already in the declining phase of this solar cycle, the Sun was rather busy on 04 November. Three rather large eruptive phenomena (M-class flares) were observed on that day.
Submitted on 2015-11-03
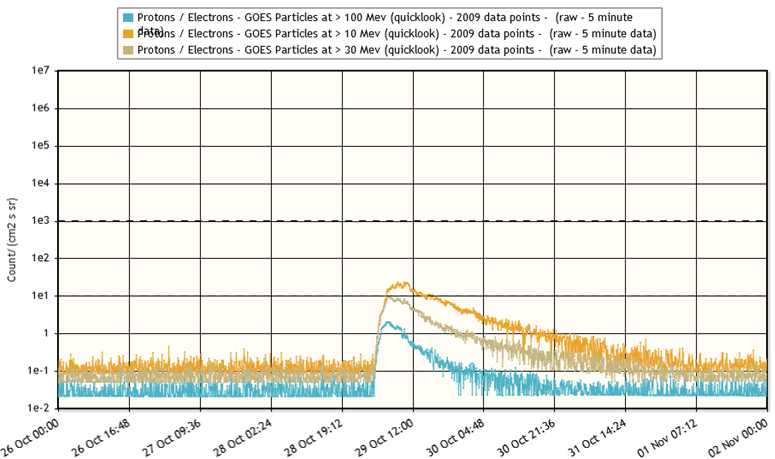
At last, another proton event in 2015! It is only the 4th event so far this year, the other three having occurred resp. on 18, 22 and 27 June (Note 1). With 23 pfu (Note 2), the greater than 10 MeV (Note 3) proton flux constituted only a minor radiation event (Note 4). The largest event this year took place on 22 June (1070 pfu), and the largest proton event so far this solar cycle was recorded on 8 March 2012 (6530 pfu, following an X5 flare from NOAA 1429 - Note 5).
Submitted on 2015-10-27
No, this news item is not going to make publicity for a social network!... Instead, it will simply take a closer look at some sunspot groups that at first sight seem to be clearly separated, but upon examination of their magnetic field configurations, are connected to each other after all.
Submitted on 2015-10-14
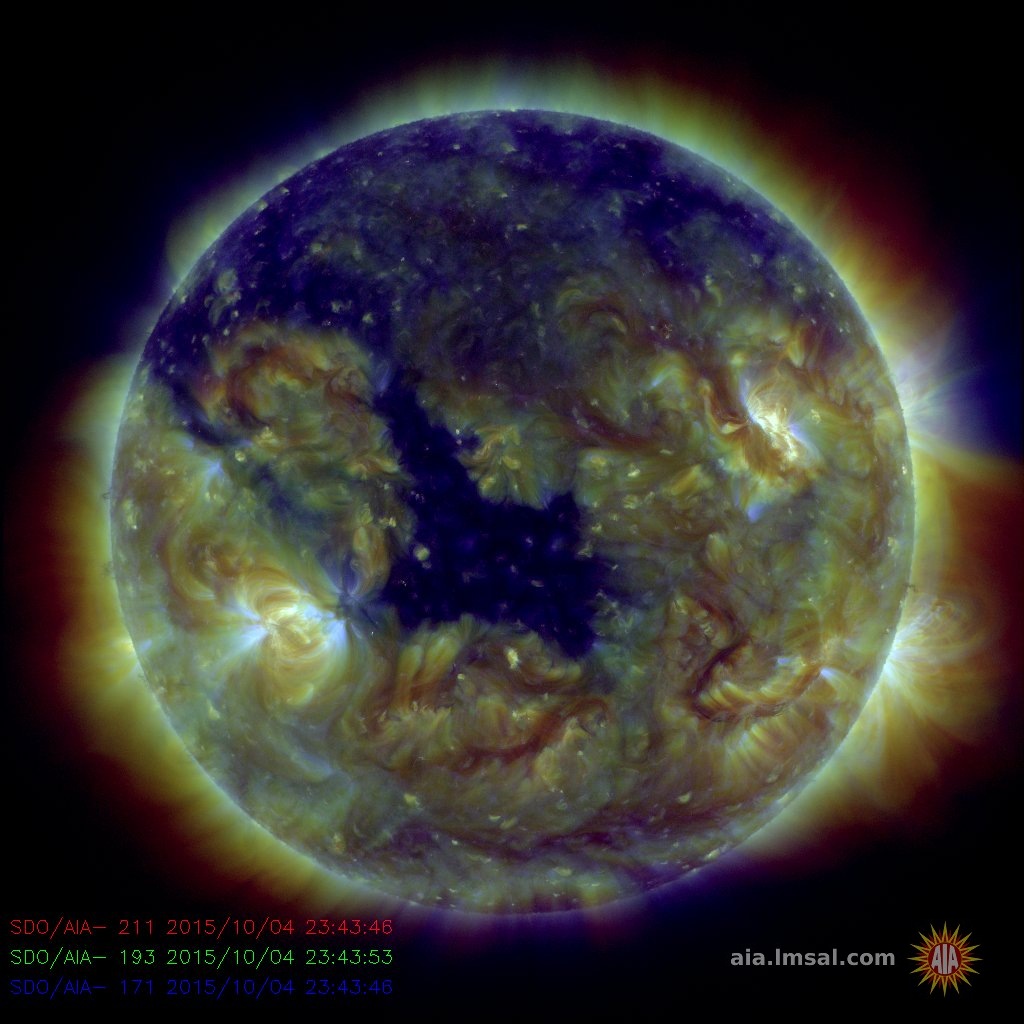
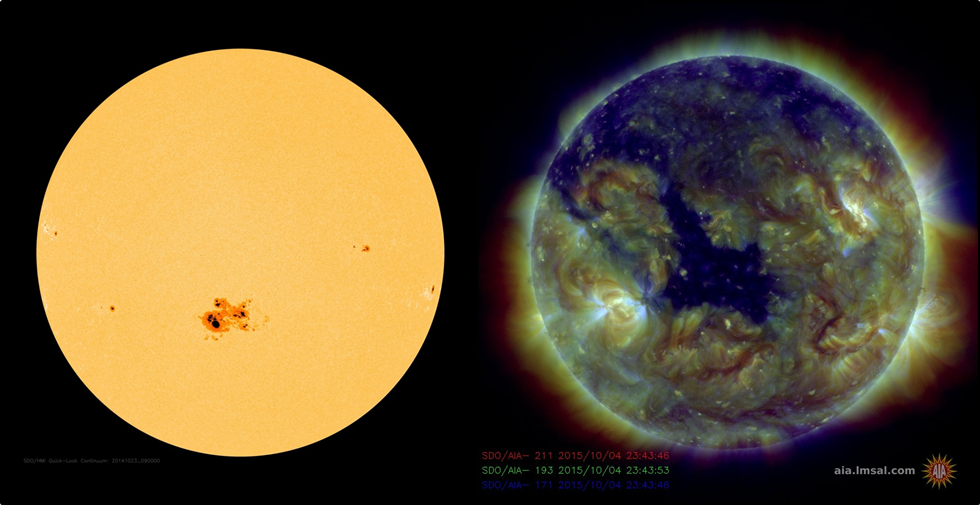
On 04 October, a rather large transequatorial coronal hole (CH) transited the Sun's central meridian. According to LMSAL data, it had a surface area of nearly 150 times that of the Earth. For comparison: NOAA 2192, the largest sunspot group so far this solar cycle, was about 9 times smaller!
Submitted on 2015-10-06
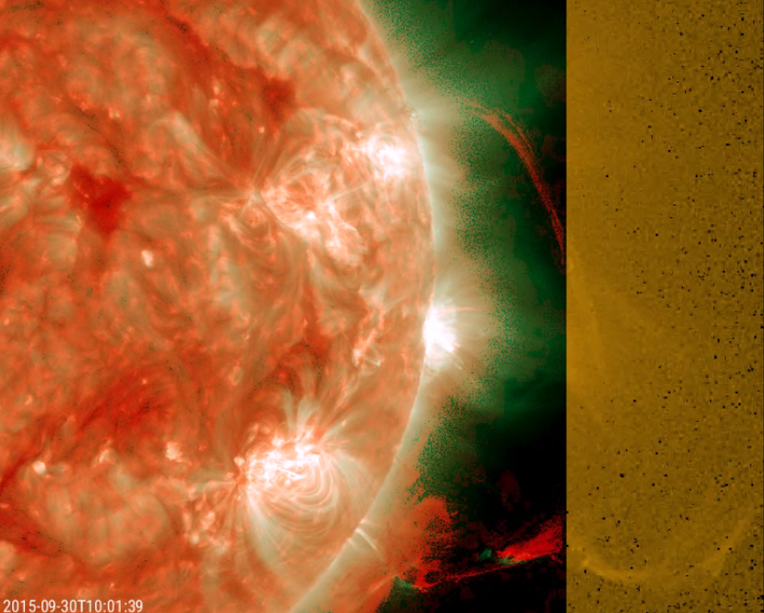
On 30 September, a prominence near the southwest solar limb got ejected into space. Prominences are clouds of plasma (charged particles) which are suspended in the corona, squeezed between large magnetic fields of opposite polarity, but denser and cooler than the surrounding coronal plasma. The structure had been visible during the last 2 weeks, before the surrounding magnetic field became unstable and ejected it into space starting around 07:30UT.
Submitted on 2015-09-30Rise and shine: That's exactly what active region NOAA 2422 did last week. From nothing, it started to emerge on 22 September as a simple bipolar sunspot region. Over the next few days, it developed into a fully mature sunspot group, gradually increasing its magnetic complexity. Until the 26th, it produced only a handful of C-class flares. However, by then, it had developed significant delta structures, i.e. spots of opposite magnetic polarity within the same penumbra, in its middle portion.
Submitted on 2015-09-23NOAA 2415 started out as a rather quiet and dull sunspot group, until during the afternoon of 14 September a bipolar magnetic flux emerged right in front (to the southwest) of NOAA 2415's main leading spot. During the next few hours and days, the newly bipolar region developed further, with the positive (white) polarity spots drifting away to the west. However, its negative (black) trailing spots remained very close to the original main spot (white), and started to interact with each other.
Submitted on 2015-09-16
This item was written by Matthew West and the PROBA2-team, and can also be read at their P2SC webpage.
Pages
Zircon - This is a contributing Drupal Theme
Design by
WeebPal.


