news
Submitted on 2018-01-01
BIRA-IASB announced a new reference solar spectrum based on SOLAR/SOLSPEC observations on board the International Space Station.
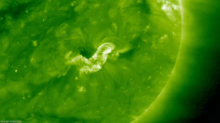
Submitted on 2017-12-06
A long filament was visible on the Sun last week. It appears to be the remnant of active region NOAA 2673, source of the strongest solar flares so far this solar cycle.
Submitted on 2017-11-17
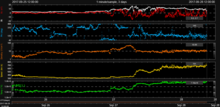
The SIDC team is pleased to announce a new release for STAFF, a solar timeline viewer.
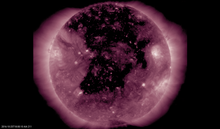
Submitted on 2017-10-19
Two strong coronal mass ejections emanated from behind the Sun's east limb on 18 October and may herald more active solar conditions in the days ahead.
Submitted on 2017-10-16
A compilation of the most memorable space weather moments of 2016 can be found underneath. A ***MOVIE*** was created containing one or more clips of each event.
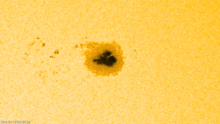
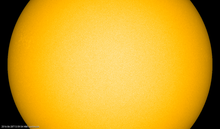
Submitted on 2017-10-11
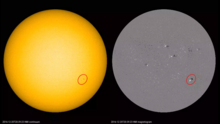
After two months of increased solar activity, the Sun has turned spotless again on 8 October.
Submitted on 2017-10-04
The PROBA2 team is happy to announce the release of a new data product: the O+N2 Earth atmosphere number densities derived from PROBA2/LYRA occultation data.
Submitted on 2017-10-04
An artist's impression of ESA's Solar Orbiter in front of a stormy Sun. The spacecraft is currently being prepared for its 2019 launch from Cape Canaveral, USA.
Submitted on 2017-09-28
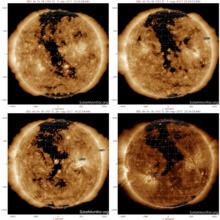
Earth is currently (28 September) under the influence of a high speed stream from a coronal hole. A strong geomagnetic storm is in progress. Polar lights will not be visible from Belgium.
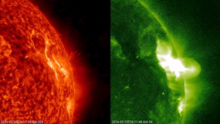
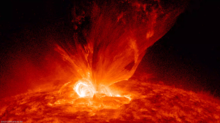
Submitted on 2017-09-21
Some additional and impressive images of the two strongest flares that NOAA 2673 produced.
Pages
Zircon - This is a contributing Drupal Theme
Design by
WeebPal.