
In the afternoon of July 12, 2012, the complex and up-to-then relatively quiet sunspot group NOAA 1520 all of a sudden produced an extreme solar flare.
The X1.4 flare started at 15:37UT, reached its peak at 16:49UT, and ended at 17:30UT, making it a long duration event. It is only the 14th X-class flare recorded so far in solar cycle 24 (SC24). Being already in the 42nd month, this is a low number of X-flares compared to the previous solar cycle 23 (22) or to SC22 (73, and already past its cycle maximum!). The 12 July flare and subsequent coronal mass ejection (CME) showed some interesting features.
Location of the solar flare
The figure underneath shows the outlook of NOAA 1520 on the day of the flare, as imaged by the SDO-instruments (http://sdo.gsfc.nasa.gov/ ). The top 4 images are taken at 16:30UT, the third pair at 16:45UT (peak), and the bottom pair at 18:55UT. This movie shows the evolution of the event in H-alpha and EUV.
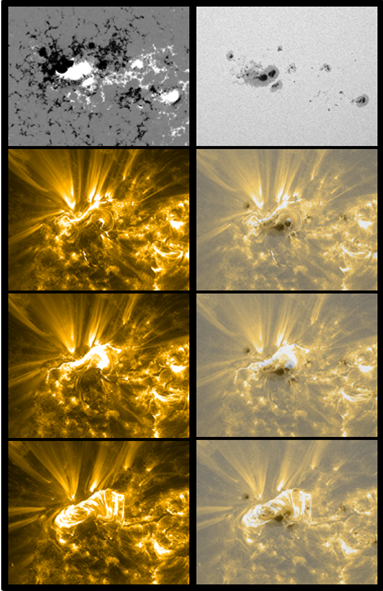
NOAA 1520 is the 2nd biggest group (after NOAA 1339) of the ongoing SC24, which -so far- has developed only five groups that exceeded 1000 MH in sunspot area. The group is very complex, and the magnetogram shows several areas of mixed magnetic polarity quite close together. In the SDO/ AIA171 images, one can see that filaments have formed along the inversion line (transition zone from one polarity to another) to the right, top and left of the main spot (see top 4 images). It is also there that the solar flare developed: mostly to the left from the filament structures, but partially also covering the upper half of NOAA 1502's main spot. This can be seen in the right series of images, where the SDO/ HMI Continuum has been laid over the AIA images. Notice also the delicate post-flare coronal loops visible in the bottom pair of images.
Radio-observations of the flare
The Humain radio-telescope was also monitoring the Sun at the onset of the flare. The figure underneath shows the evolution of the x-ray flux from 15:15UT till 19:15UT. Below this graph is the radiospectrogram from the Humain radio-telescope for the same period. It shows two features.
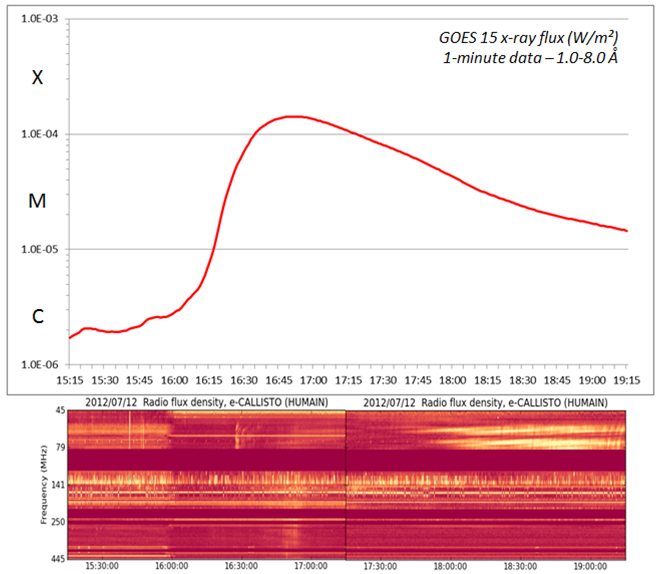
First, a type II radio-burst can be seen around 16:30UT. This type of burst is thought to be excited by magnetohydrodynamic (MHD) shockwaves associated with Coronal Mass Ejections (CME) traveling through the corona. From the frequency-drift, one can calculate the speed of the shock. In this case, NOAA calculated this to be at over 1200 km/s. Even more interesting is that the observed shock and resulting radio-burst occurred well before the peak of the x-ray flux around 16:50UT.
The second feature is the bright radio emission continuum that can be seen starting around 17:45UT and lasting for several hours. This is a type IV radio burst and it often accompanies a type II radio burst. Type IV bursts are believed to be generated by the emission of electrons trapped in post-flare loops (see above). Sometimes, also a frequency drift is observed which in turn is linked with the formation of the loops at successively higher altitudes.
Geomagnetic effects from the CME
The Advanced Composition Explorer (ACE - http://www.swpc.noaa.gov/ace/MAG_SWEPAM_3d.html ) continuously measures the solar wind at 1.5 million km in front of the Earth. As such, it recorded the arrival of the shock preceding the CME on 14 July at 17:28UT.
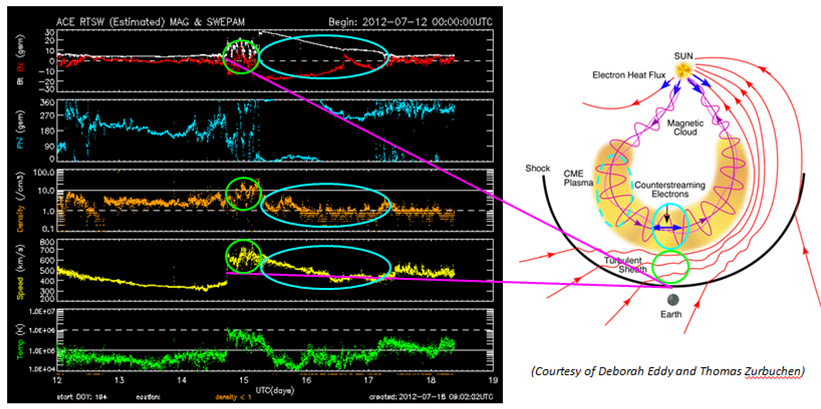
The measurements of the magnetic field strength and speed show a typical CME signature. The figure above shows the constitution of the disturbance and how it influenced earth's environment. The arrival of the shock is marked by a sudden increase in the solar wind speed (yellow) and the magnetic field strength (white and red). Then follows a region which is also not part of the ICME. It is an accumulation of solar wind particles swept up between the shock and the actual CME, ICME, something similar to the folding of a table cloth when quickly moving his hand on it. The passage of this turbulent region is characterized by rapidly varying intensities of wind speed, density (orange) and magnetic field strength. Earth was in this region for nearly 12 hours: from July 14 at about 18:00UT till July 15, 06:00UT. Only then arrived the true CME, which was in this case a low density and low temperature (green) plasma cloud with a gradually decreasing field strength and wind speed. Remarkably, the passage of this CME lasted almost 1.5 days till late July 16, and displayed a very monotone evolution of the cloud's parameters. The reason for this might be that Earth did not pass through the front of the CME, but through its flank.
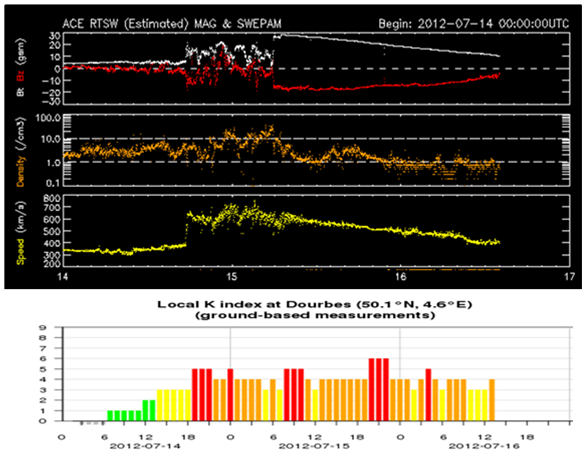
As the moderately strong magnetic field was oriented southward, Earth suffered from a major geomagnetic storm. This was recorded by the Dourbes Geomagnetic Observatorium (http:// gpsweather.meteo.be/geomagnetism/ground_K_dourbes ). The storm was not strong enough to create aurora visible from Belgium. Nonetheless, polar lights were seen as far south as Wales and The Netherlands (low above the horizon).
 |
 |
