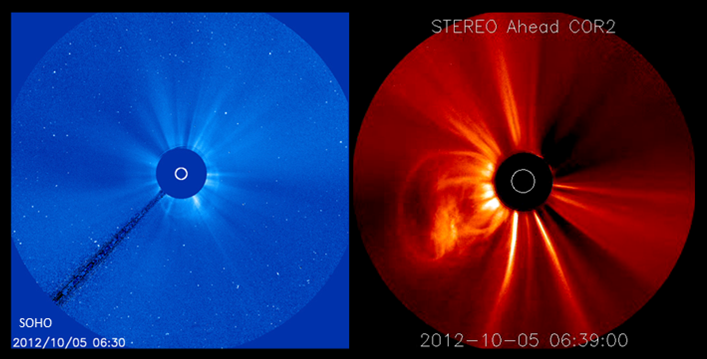
As discussed in the previous STCE Newsletter, the very Long Duration Event from 5 October propelled a coronal mass ejection (CME) towards Earth. From the SOHO and STEREO imagery, forecasters concluded that this CME would deliver a glancing blow late on 8 October or on 9 October.

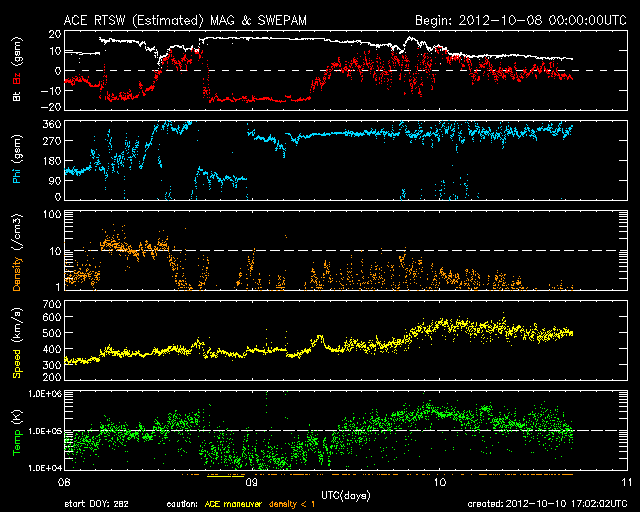
Surprisingly enough, the CME struck already during the early morning hours of 8 October. It had also a very interesting magnetic signature (Bz - red curve in ACE-graph underneath, indicating whether the orientation of the magnetic field is northward or southward). There is a first period having a southward orientation from 4 o'clock till noon, then follows a north-oriented period from noon till 18:00UT, concluded by another southward episode till 7 o'clock on 9 October. After that, the (expected) influence of a coronal hole (CH) can be seen in the slow increase of wind speed (yellow curve) and the (much) higher temperatures (green curve).

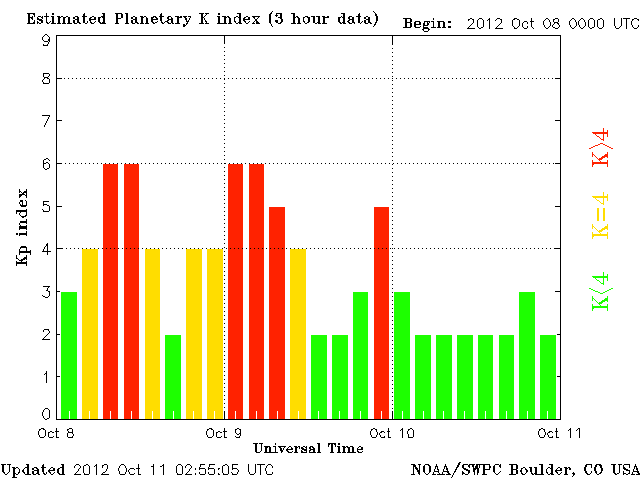
Because of the southward direction of the magnetic field, the geomagnetic field experienced moderate storming levels three times: During the morning hours of 8 October, again early on 9 October, and finally late 9 October under the influence of the CH. Thus, the question how *one* CME could produce *two* storm periods begs for an answer.

ACE, the spacecraft that is measuring the solar wind, is located well outside the geomagnetic field. As it recorded these separate periods in the solar wind en route to Earth, the geomagnetic storms had to be a consequence of true changes in the solar wind.
An additional examination of STEREO and SOHO-images by Space Weather forecasters at the STCE revealed there was no other CME involved. But why was this one so early? Scrutiny of the ACE-data indicated there is no doubt that the second period with negative Bz-values is the true CME. That one arrived around 18:00UT, well within the uncertainty limits of the prediction. Forecasters can tell this is the CME because of the low temperature of the particles (i.e. a lot lower than that of the subsequent CH).

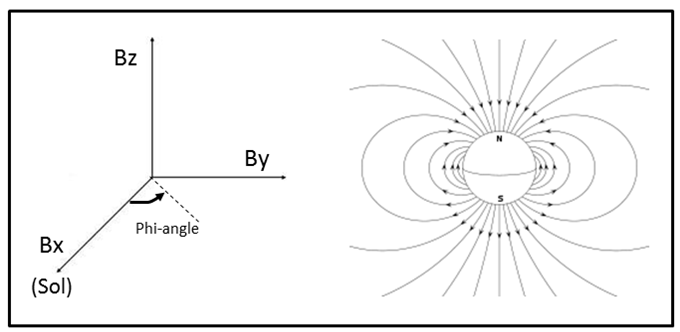
The first period with negative Bz-values and the short period with positive Bz-values seem to be embedded in the solar wind. This is not part of the CME, but concerns particles swept up by the shock wave driven by the arriving CME (for another example, see also the 14 July Newsletter). This conclusion is based on the temperature of the particles, which is a lot higher than that inside the CME, as well as on the very erratic behavior of the orientation of the magnetic field in the ecliptic plane (so-called Phi-angle: the blue curve in the ACE-data) during that time frame. The slow solar wind, and the Earth passing through the flank of the CME, may thus explain this lengthy and unusual prologue to the true CME.
 |
 |


