
This news item was written by Frederic Clette, WDC - Sunspot Index.
Many solar cycle predictions are based on mathematical or physical models. Current models are only able to produce a smooth global envelope to describe the variation of solar activity during one 11-year cycle, as illustrated in figure below. So, we are used to consider a solar cycle as a rather smooth bell-shaped curve with some asymmetry. This is definitely affecting the current interpretations of the rise of cycle 24.
After a prolonged minimum and slow start, the initial phase of cycle 24 was marked by a fairly steep rise, followed by a quite sudden shutdown in early 2012. Indeed, after a peak of activity by the end of 2011, the solar activity, as measured by the sunspot number Ri, settled at a rather constant plateau of about Ri=55. This scenario was not predicted by the models and led many to speculate that the Sun would already have passed an early maximum. Thus, perhaps after some delay, they were expecting the onset of a decline towards the next minimum.
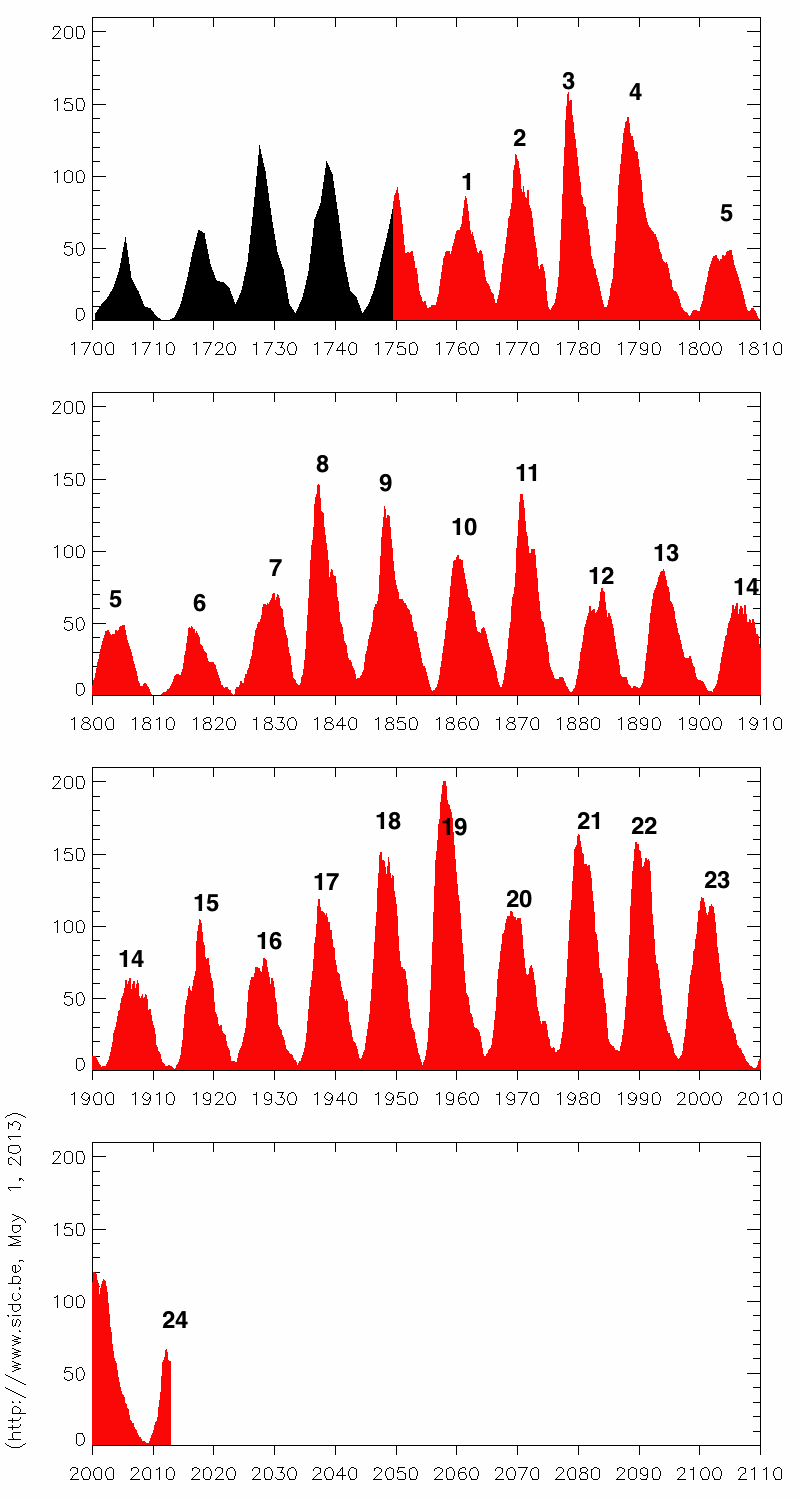
Various symptoms in the Sun's current behavior are contradicting this view, but we can also learn a lot from the sunspot number record that retraces the actual variations of solar activity over no less than 23 past solar cycles. The red bumps in the graph below represent a cycle and are numbered from 1 to 24, the present cycle. This unique time series shows what the Sun is truly capable of and how the magnetic activity actually ramps up and down during each cycle. As it turns out, the cycle envelopes prove to be much more diverse than in models!
For instance, in the plot underneath, the solar cycles have been superimposed by aligning the Ri=15 crossing point in the declining phase of foregoing cycle. A comparison quickly reveals that solar cycle 24 (thick red curve) is indeed among the "late" cycles, but that by no means it is an extreme or unprecedented one.
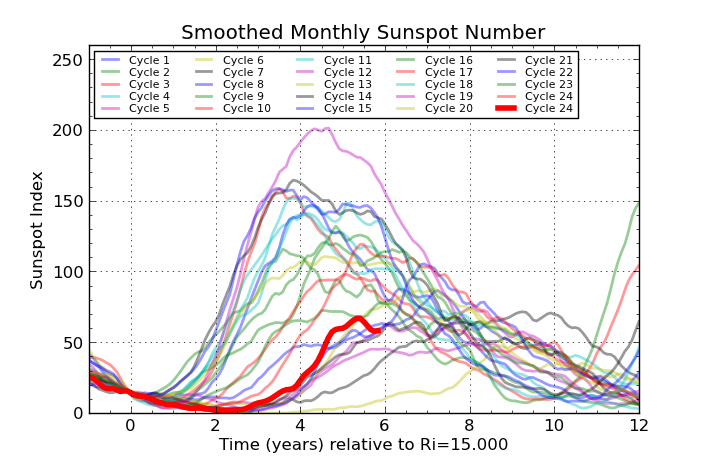
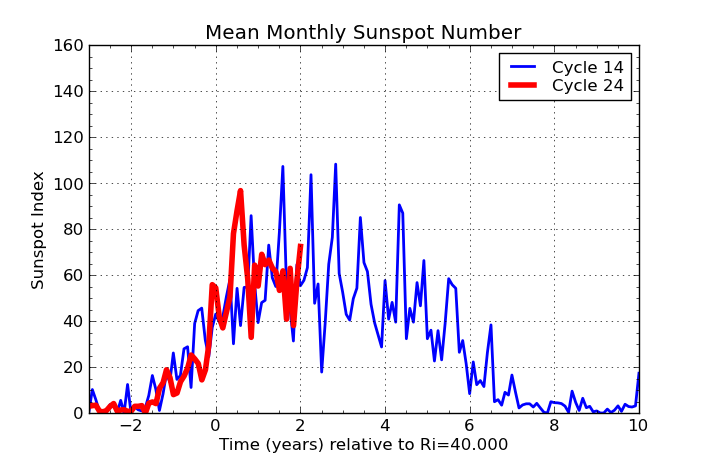
The only cycles that closely fit the current rising phase all date back to the late 19th and early 20th century (cycles 12, 14, 15, 16 - see figure underneath). These were "low" to "average amplitude" cycles. On the other hand, solar cycle 24 does not match at all weaker cycles like the ones during the Dalton Minimum (cycles 5 and 6), nor cycle 4 preceding this period of very low activity. Therefore, the ongoing cycle is not heralding an evolution towards an extended grand minimum after cycle 24.
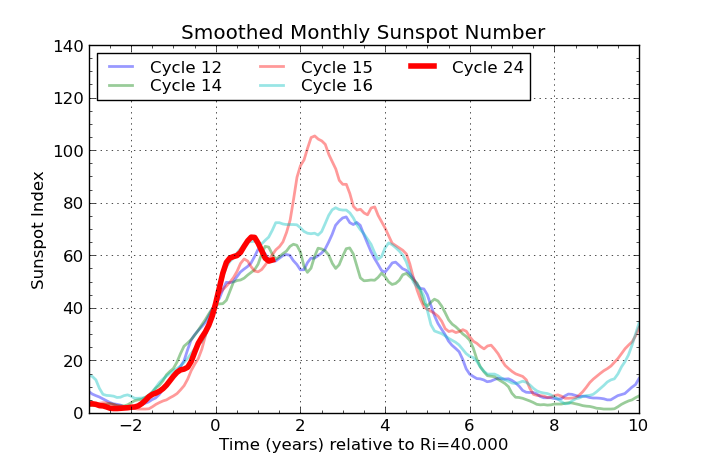
Now, if we use only non-smoothed monthly mean sunspot numbers, we find as best matches solar cycles 14 and 15, in the early 20th century. One can see that those cycles were marked by multiple sharp "surges" of activity, producing successive spikes separated by depressions or flat intervals. In particular, the early evolution of cycle 15 has a striking similarity to cycle 24, with a steep rise to about Ri=50 followed by an 18-month plateau. The activity then rose again to the actual maximum, at twice the amplitude of the initial plateau (absolute Ri=150). It looks as a protracted version of a "hump" marking the "half-way" point in the rising phase of several other solar cycles.
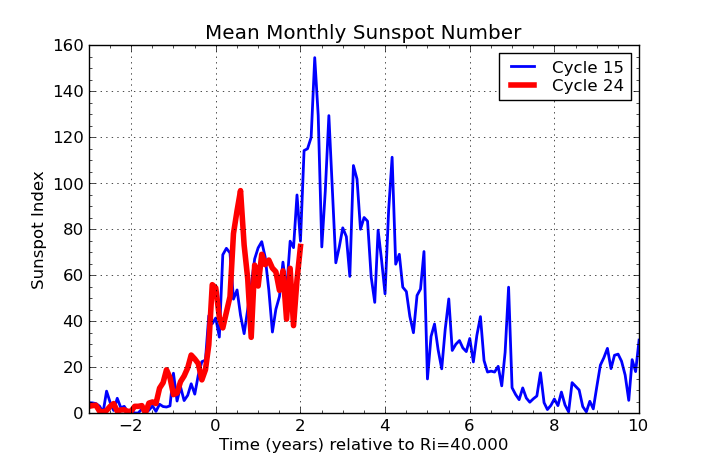
So, it is certainly possible that this past scenario could repeat itself in the current cycle! This means that we should be prepared for the onset of a new sharp rise to much higher solar activity, right now or in the next few months.
Now, is the recent surge of activity of the last two months marking the final "true" rush to the maximum? Only the Sun will tell, but the past long-term record reminds us to stay alert for possibly much higher activity levels for the remainder of 2013.
 |
 |
