
Without a doubt, the big and complex sunspot group NOAA 1944 was the talk of the week. During its transit over the solar disk (1-14 January), it produced 1 X- and 7 M-class solar flares. Here we will deal with some of the more enigmatic aspects of the group's size and the X-class flare it produced.
1. Was NOAA 1944 the largest sunspot group so far this solar cycle?
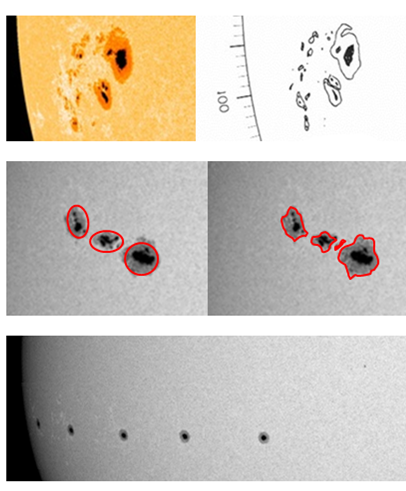
The short answer is yes. We have to go back to July 2004 (previous solar cycle SC23) to find a significantly bigger group (NOAA 10652). However, determining the area of a sunspot group is not an easy task. It depends on factors such as the medium used (drawing, picture, filter,...) and the calculation methodology (e.g. area of individual spots or one size fits all,...), as can be seen in sketches underneath. Moreover, if one wants to know the true size of the group, one has to correct for the line-of-sight. Indeed as the Sun is a sphere, a sunspot near the limb looks a lot smaller than an equally sized sunspot near the disk's center. Hence, small deviations in the measurements may result in a very different outcome for the sunspot area.
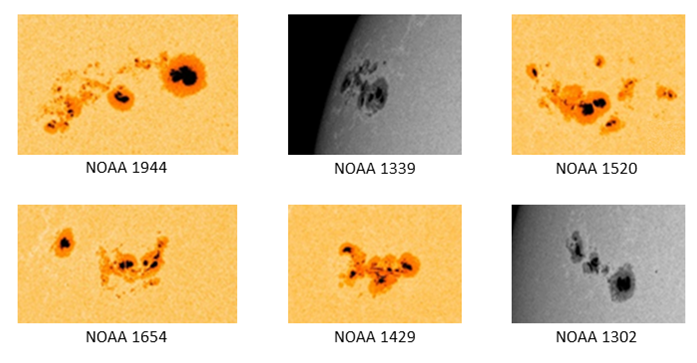
For all these reasons, the area data can differ substantially from one source to the other. Applying this consistently on SDO/HMI imagery, it turns out that the maximum area for NOAA 1944 (7 January 2014) seems to be slightly larger than that of NOAA 1339 (3 November 2011, limb!) and NOAA 1520 (10 July 2012), resp. about 1% and 4%. These three groups were significantly larger than 3 other substantial groups of SC24: NOAA 1654 (11 January 2013), NOAA 1429 (7 March 2012), and NOAA 1302 (24 September 2011), by about 40%. A family portrait of these sunspot regions can be found underneath.
2. Did the X1.2-flare take place in NOAA 1943 or 1944?
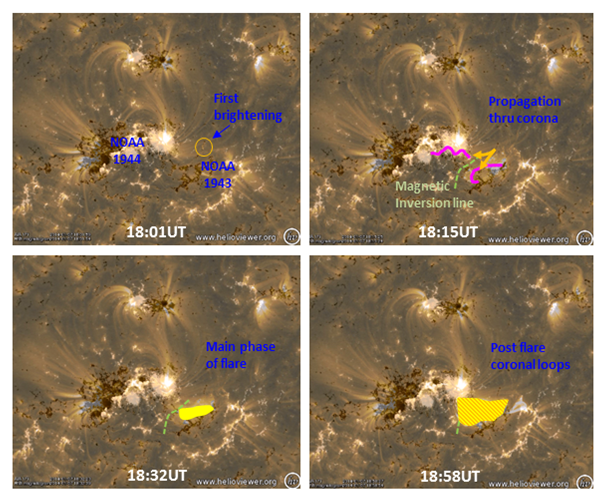
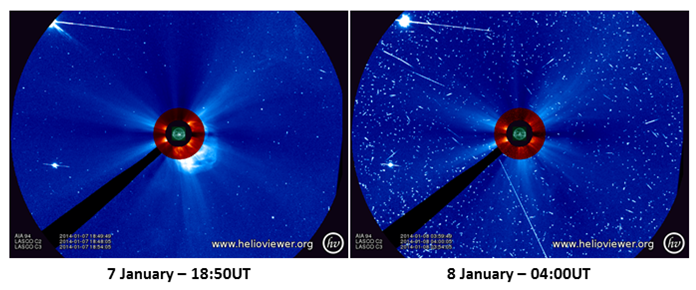
On 7 January, NOAA 1944 produced 2 strong flares: An M7 flare peaking at 10:13UT, and a few hours later at 18:32UT, a powerful X-class flare (number 28 of the ongoing solar cycle 24). The M-class flare clearly took place in the trailing part of NOAA 1944, but ascribing the location of the X1.2 flare to NOAA 1944 proved to be a little more difficult, as can be seen in this MOVIE.
The reason for the problem was that the brightest part of the flare was located over the trailing part of the -at that time- spotless region NOAA 1943. The movie shows that the initial brightening took place to the north of the trailing part of NOAA 1943, and to the west of NOAA 1944's main spot. Then, it propagated southwards alongside the magnetic inversion line (see sketch underneath). Clearly, there's an interaction between the two regions, i.e. the positive (white) magnetic polarity part of NOAA 1944 and the negative (black) spotless portion of NOAA 1943. From a forecaster's point of view, the attribution of the X-class flare to NOAA 1944 is certainly a great decision. Indeed, it avoids exceedingly high probabilities on X-class flares for future spotless active regions! But on what exactly happened during the 7 January event in the solar corona, the jury is still out.
3. Is the X1.2 proton flare considered as a separate proton event?
The issue here is that proton flares are not considered as separate events if the proton flux (particle energies larger than 10 MeV) at the time of the event is still above the threshold of 10 protons per flux unit (pfu). A nice example is the sunspot group NOAA 10720 from January 2005 (very similar in size as NOAA 1944): There was one single proton event covering 3 strong X-class solar flares (all from NOAA 10720) that kept the proton flux well above the 10-pfu-threshold for nearly a week (16-22 January 2005)!
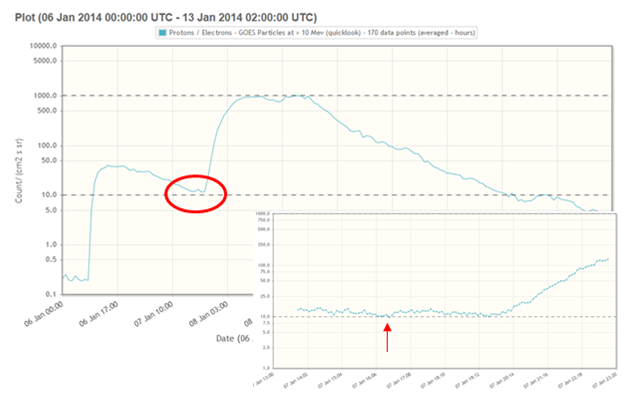
In the case of the 7 January X1-flare, the proton flux was already elevated due to a flare from NOAA 1936 which had rounded the west solar limb 2 days before (so not visible anymore from Earth!). As a result, this flare did not leave an x-ray signature, but the protons started to increase the flux on 6 January at 08:20UT. The flux peaked already at 42 pfu in the afternoon of the same day. The flux only gradually decreased, and by the time it started to increase again due to the X1-flare (around 19:00UT the next day), it was still slightly above the event threshold. However, at one data-point (16:30UT), it had dipped just below the threshold. So technically, this can be considered as a separate proton flare. The proton events are currently listed as separate items on the NOAA's Solar Energetic Particle page. In the end, the proton flux rose to 1030 pfu, making it the strongest event since 22-25 May 2013.
Credits - Data and imagery for the movie clips were taken from SDO, SOHO/LASCO, Kanzelhöhe, NOAA/GOES, and NOAA/SESC. Tools used were STAFF and (J)Helioviewer.
 |
 |
