Coronal holes (CH) are regions in the hot solar atmosphere ("corona") where the plasma density at that temperature is very low compared to its surroundings, and thus they look like dark shapes in the corona. Linked to unipolar magnetic fields stretching into space, they are the source of the high-speed solar wind and can create geomagnetic disturbances.
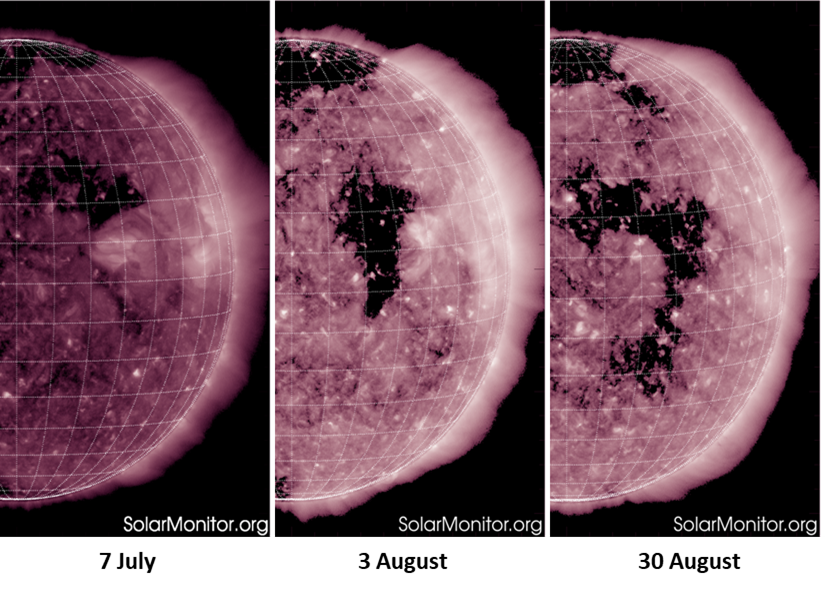
Early July, a small coronal hole started to develop in the northern hemisphere, possibly from an extension of the northern polar coronal hole. It had a positive magnetic polarity, meaning that its magnetic field was directed away from the Sun. One solar rotation later, this CH had substantially grown in size, and during its latest transit late August it had evolved into a distinct shape resembling the number "7". The evolution can be seen in the extreme ultraviolet (EUV) images taken by the SDO/AIA instrument on 7 July, 3 August and 30 August - each image a solar rotation apart.
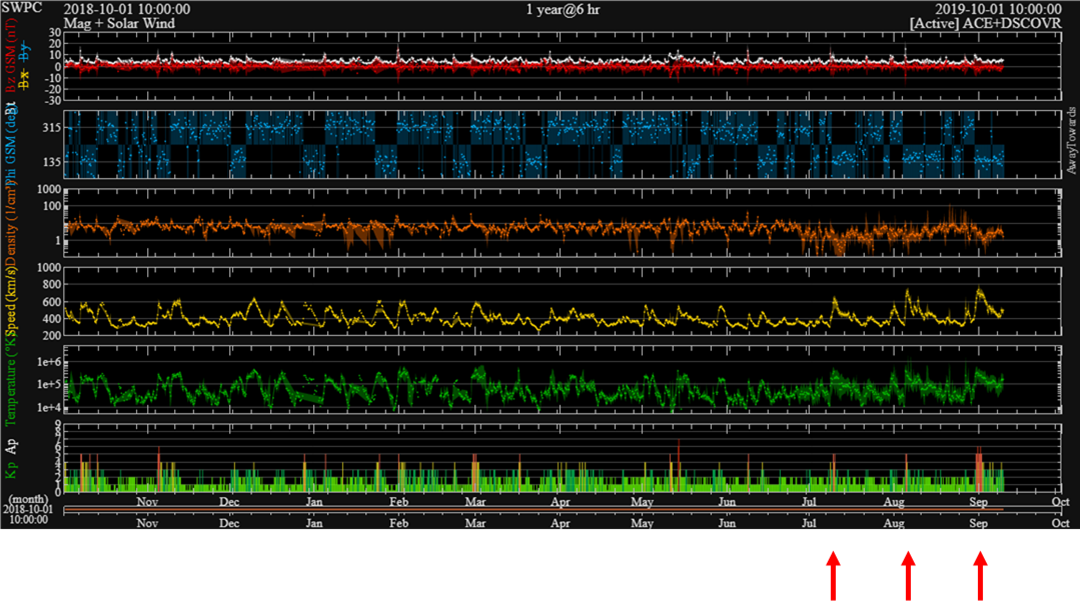
As is usually the case, the more distinct and the larger the size of the coronal hole, the larger the speed of the associated wind stream. No surprize here, with respective maxima for the hourly averaged wind speeds of 644 km/s, 719 km/s and 750 km/s. However, what is surprizing is the very high value of the wind speed. In fact, as can be seen in the chart underneath (speed indicated by the yellow curve), these values (in particular the last two peaks, as indicated by the red arrows) are the highest recorded in more than a year. During each of the wind stream passages, geomagnetic storming was recorded (preliminary Kp index), as can be seen in the bar chart at the bottom.
Fast solar wind streams from coronal holes are also known to drive highly energetic (energies of more than 2 MeV) electrons. The precise mechanism is not well understood yet, but it is believed that the high-speed wind streams can drive magnetic oscillations in the magnetosphere with typical periods from tens to hundreds of seconds, pumping energy into the system. Known as Pc5 waves, these are known for their potential to accelerate electrons to relativistic energies within the outer radiation belts (e.g. Kavanagh and Denton, 2007). These electrons have energies high enough to penetrate the satellite's shielding and accumulate around its instruments and critical components. This is called deep di-electric charging (see the STCE newsitem "Itchy satellites"), and when a threshold is reached, they can lead to electrostatic discharges (ESD) resulting in malfunctions of the satellite and occasionally even in the satellite failure.
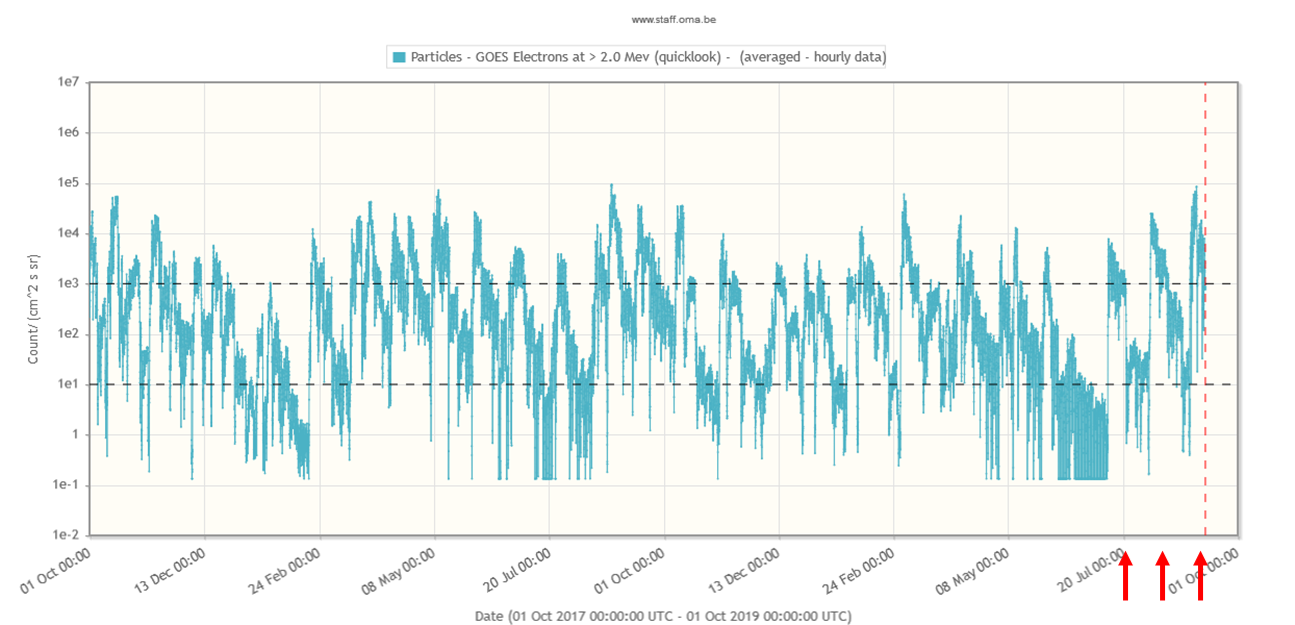
Last week's CH wind stream resulted in one of the highest >= 2 MeV electron fluxes observed during this solar cycle. This can be seen in the graph underneath (created with STAFF) displaying the electron flux in particle flux units (pfu; vertical axis - note the logarithmic scale!) for the period from 1 October 2017 till present (horizontal axis). The dashed line at 1000 pfu (1 pfu = 1 electron / cm2_s_sr) indicates an alert level used by NOAA/SWPC, but other alert levels exist usually being based on total fluxes accumulated over 1 or 3 days ("fluence"). The red arrows indicate the effect of the three wind streams from the aforementioned coronal hole. In particular during last week (the last peak) the fluxes were very high, attaining values close to 90.000 pfu on 4 September, or 90 times above the alert level! Also, the daily electron fluence was above 1 billion electrons/day_cm2_sr from 2 till 4 September, i.e. at very high levels. No wonder then that satellite operators scrambled to their monitors keeping a very close eye on these energetic electron fluxes and their effects on the satellite fleet.