
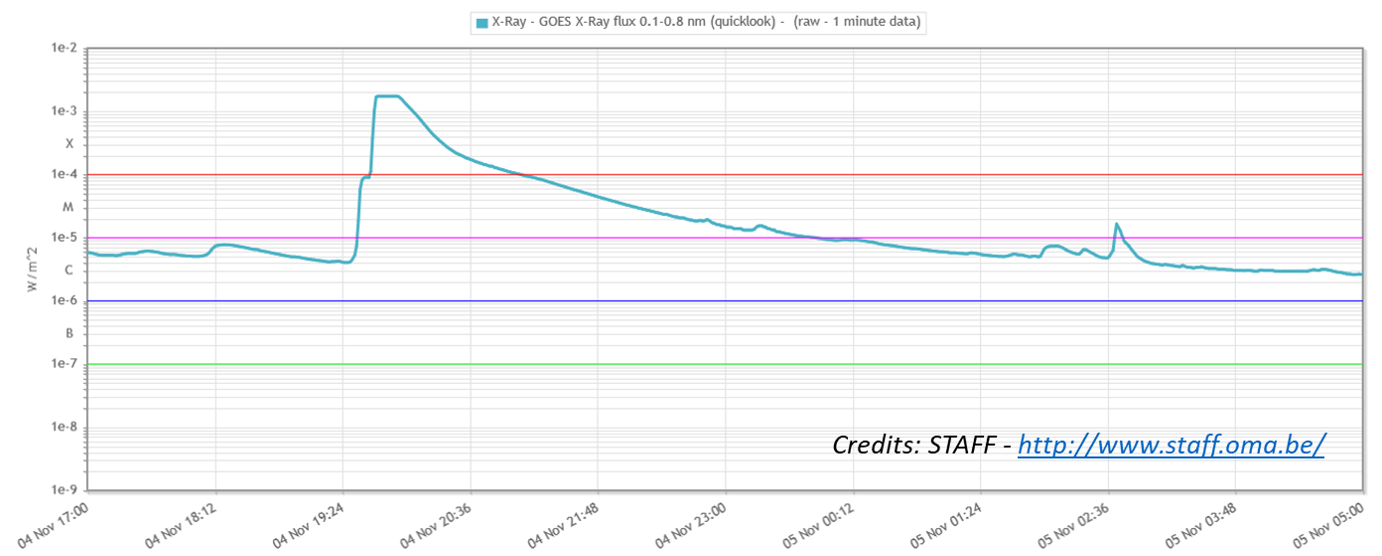
Solar flares can be ranked according to their peak energy output in x-ray (0.1-0.8 nm ; See the STCE's SWx classification page). The scheme is labeled "CMX": C, M, and X stand for small (or "Common"), Medium, and large (or "eXtreme") flares. The range is logarithmic, each class being 10 times stronger than the previous one, and within each category ranging from 1 to 9 (e.g. a C9 flare, an M3 flare,...). The strongest solar flare since the start of the GOES measurements in 1976 took place on 4 November 2003. The eruption saturated the GOES x-ray sensor at X17.4, but subsequent analysis has put the most likely peak strength near X35 +/-5. The evolution of the flare can be seen in the graph underneath and was generated using the online STAFF tool. Notice the saturation at X17.4 for 12 minutes, thus requiring some statistical methodologies to infer the most likely peak flux. The peak x-ray flux for the Carrington event is thought to have been X45 +/-5, but of course there were no GOES satellites to measure this flare back then (see the Cliver and Dietrich (2013) article in JSWSC).
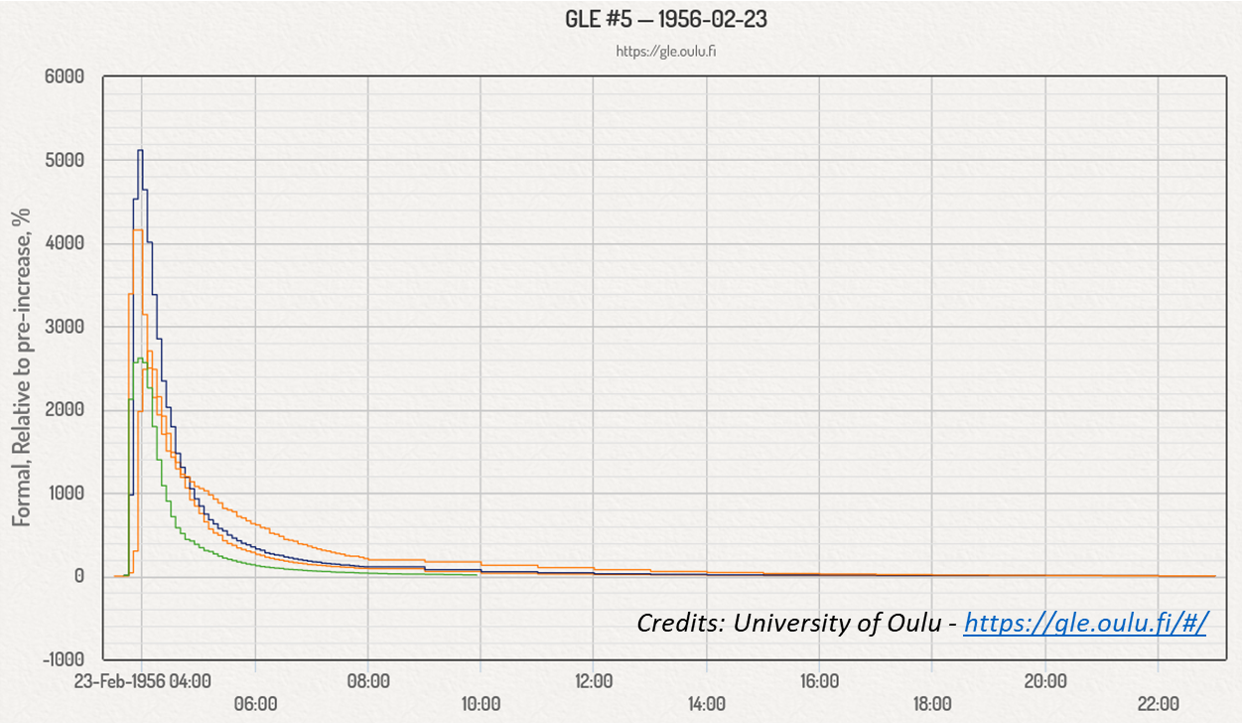
During strong solar eruptions, it can also (but not always) happen that protons are accelerated to energies ranging from as low as 1 MeV to as high as 100 GeV (see the SWx acronym list for units). When the greater than 10 MeV proton flux reaches a threshold of 10 pfu (proton flux units), it is called a proton event. Since systematic GOES measurements started in 1976, only 268 proton events have been registered, an average of about 60 events per decade. During this period, the largest event took place in March 1991 and reached a peak of 43.000 pfu. Protons interact with particles in the Earth's upper atmosphere. When the protons have energies greater than 430 MeV, the secondary particles that are created from these interactions can reach the Earth's surface and be measured by neutron monitors such as in Dourbes (see the NMDB). These are called Ground Level Enhancements (GLEs) and are very rare. In fact, since the first measurements started in 1942, only 72 GLEs have been recorded, an average of not even 10 per decade. The largest GLE recorded by modern instrumentation is the 23 February 1956 event, which had a greater than 430 MeV fluence (i.e. accumulated number of protons over the event) about 2.5 times as large as the second strongest event on the list, an episode of five strong GLEs from August through October 1989. Underneath is a graph created from the Oulu GLE webpage showing the evolution of the 1956 GLE compared to the pre-event values. Other GLEs have much lower intensities or are much spikier (i.e. short-lived).
The secondary particles responsible for the GLEs may also deposit themselves in trees and ice. Increases in Carbon-14 concentrations in tree rings as well as increases in Beryllium-10 and nitrate in ice cores have been attributed to (solar and galactic) cosmic-ray events. In 2012, Dr Miyake from the Nagoya University in Japan and her collaborators made an important discovery (see the article in Nature). From measurements in Japanese tree rings, they found a truly astonishing increase in Carbon-14 concentration in 774–775AD. Analysis and modeling of the energies of the associated particles revealed that the 774-775AD event scaled up being 30 to 70 times larger than the 1956 GLE. An initial analysis seemed to rule out a solar flare as the culprit for this gargatuan GLE. Possible causes that were investigated were a galactic short-duration gamma burst, or a nearby supernova amongst other. However, in the subsequent years the event was also detected in other tree samples and ice cores, and also the discovery of two similar increases as the one in 774-775AD (in 993–994AD and in 660BC) argued against these other potential causes.

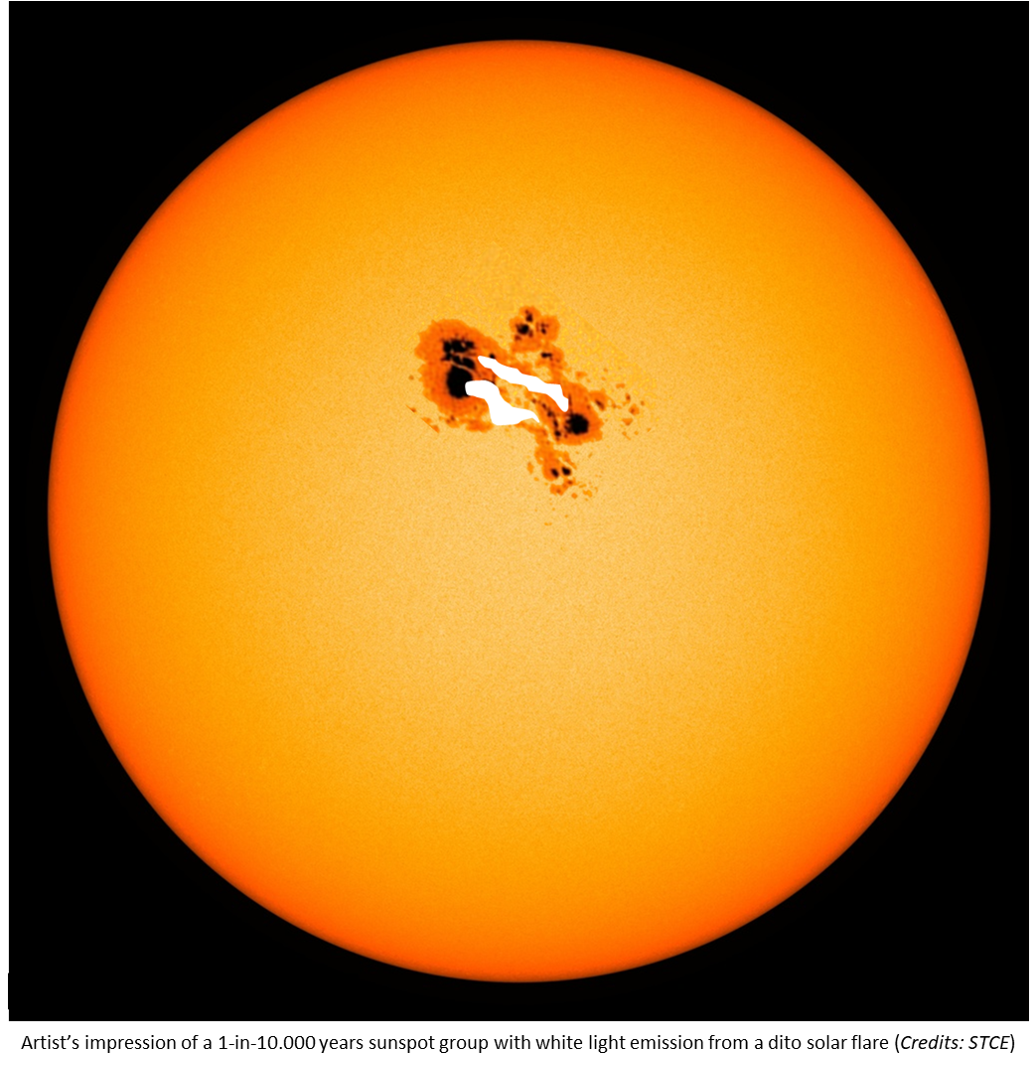
Last week, the XVIIth Hvar Astrophysical Colloquium took place in Hvar, Croatia. One of the keynote lectures was given by Dr Cliver from the National Solar Observatory (USA). The presentation is online at the Hvar Conference programme. From a statistical analysis of the sunspot groups available since 1874 (see the Solar Cycle Science webpage), he and his collaborators concluded that there's a 1-in-10.000 years chance on a sunspot group with an area up to 11.000 or 26.000 MH (millionths of a solar hemisphere), pending the methodology used. For comparison, the largest group over the last 150 years was visible in April 1947 and reached an area of 6132 MH. A similar analysis applied on the GOES solar flare data since 1976 indicated that the Sun can produce a flare peaking at X200 or X310, again depending on the statistics used. Comparing with previous work from other research teams, it was concluded that the Sun, in its current state, would be able to produce an X400 +/-200 flare, and that this was a conservative estimate.
But would the solar flare of 774-775AD fit within these peak constraints? To evaluate this, Cliver and his team first derived a peak range for the flare responsible for the colossal 1956 GLE. Though there are of course no GOES measurements available for that time, there are H-alpha, white-light, radio, indirect soft x-ray observations (via sudden ionospheric disturbances) available that can help to constrain the size of the 1956 flare. After careful consideration, they settled for a value in the range X10-X30. Then, based on the existing high-energy proton fluence data (energies greater than 430 MeV, greater than 200 MeV), using the 1956 data as a bridge, and taking into account that the 774-775AD and 1956 GLEs had a much harder "spectrum" (i.e. consisted of more energetic protons) than the modern day era events, they inferred a peak of X285 +/-140 for the flare responsible for the 774-775AD event. The intensity of the flare may be even a bit lower, if there were multiple flaring events involved similar as what happened during the August-October 1989 period. Three X140 +/-70 flares or 2 X180 +/-90 flares may result in a similar fluence for the 774-775AD event as a single X285 flare.
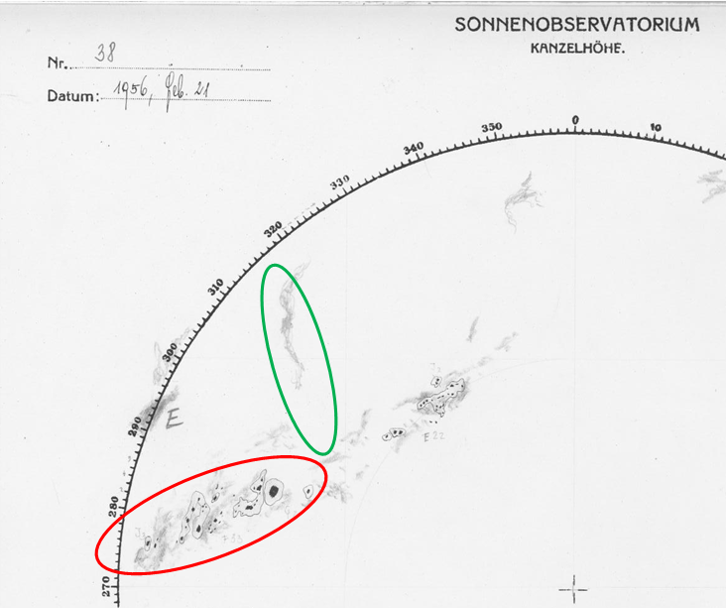
Finally, the inferred strength of the source flare may also be a bit lower than calculated if there were pre-existing conditions favoring the acceleration of protons, such as e.g. an elevated proton background from earlier proton events from the same active region. Also, recently, researchers such as Kong et al. (2019) have drawn attention to the potential importance of the magnetic field topology in the vicinity of an eruptive flare. Simulations showed that particles were accelerated more efficiently at high energies when a laterally propagating shock encountered a streamer rather than a simple radial field. The acceleration of particles to more than 100 MeV mainly occurs in the shock-streamer interaction region, due to the perpendicular shock geometry and the trapping effect of closed magnetic fields. Interestingly, the February 1956 event seems to represent such a case, as can be seen in the annotated Kanzelhöhe drawing underneath (21 February), with the filament highlighted by the green ellipse and the source region of the event marked by the red ellipse.
The details of the research can be found in the online article: Cliver, E.W.; Hayakawa, H.; Love, J.J.; Neidig, D.F. 2020. On the Size of the Flare Associated with the Solar Proton Event in 774 AD. The Astrophysical Journal, 903, 1, 41. https://doi.org/10.3847/1538-4357/abad93
The related presentation at the XVIIth Hvar Conference is at https://oh.geof.unizg.hr/index.php/en/meetings/xvii-hac/programme (Extreme solar and solar-terrestrial events).
