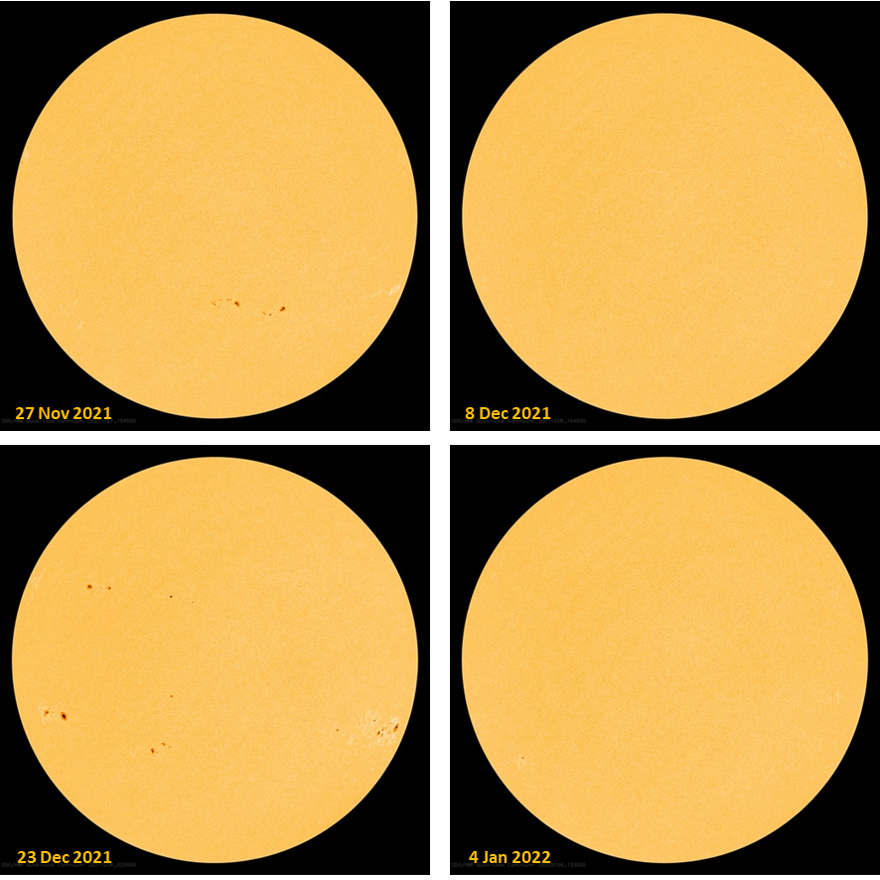
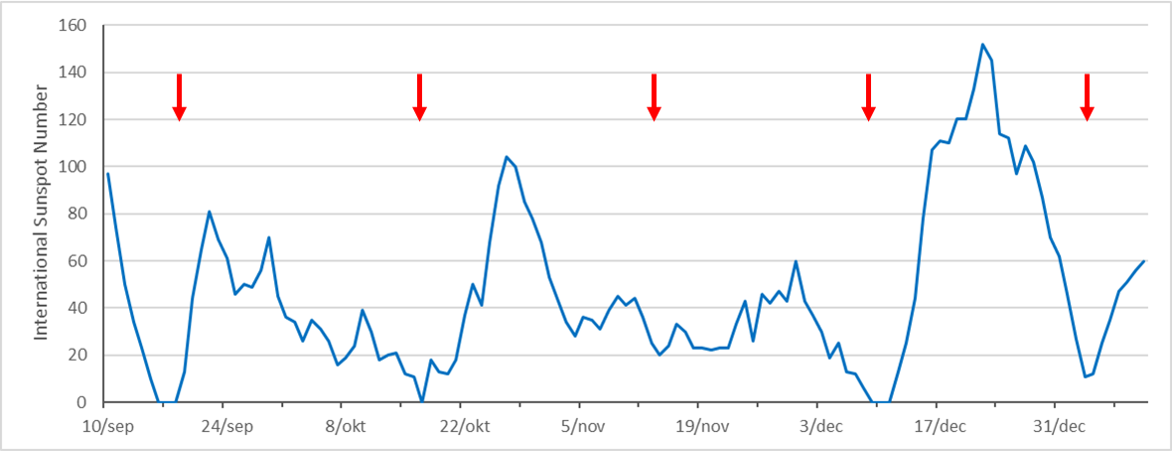
Solar observers have noticed that during the last quarter of 2021, between the 10th and 17th of each month there usually was a low in sunspot activity (occasionally even a few spotless days), whereas during the rest of the month higher sunspot numbers were observed. This can be seen in the annotated graph (SILSO data) with preliminary international sunspot numbers (ISN) from 10 September 2021 onwards. Red arrows indicate the dips in the solar activity, and as it turns out these dips are about 4 weeks spaced from each other, corresponding to about 1 solar rotation.
This more-or-less equal spacing in time hints already that the solar rotation is involved. To quantify this asymmetry in solar activity, a synoptic map is used. A synoptic map represents the full surface of the Sun but using only observations from the Earth’s viewing direction. Depending on the type of synoptic map, it could only use the data taken near solar central meridian (the "north-south" line on the solar disk), or the data from different parts of the visible solar disk (e.g. combining STEREO and SDO imagery), or from data taken on different days averaged or summed together to contribute to a selected range of latitudes and longitudes. For the purpose of this news item, the number of sunspot groups in 2021 and their respective locations (latitude and longitude - see sketch) as recorded each day were used to create a synoptic map for the solar surface in 2021. Data were taken from the NOAA/USAF network (https://www.swpc.noaa.gov/products/solar-region-summary ). Complete solar rotations were utilized from late December 2020 (Carrington Rotation number 2239) till early January 2022 (Rotation number 2252).
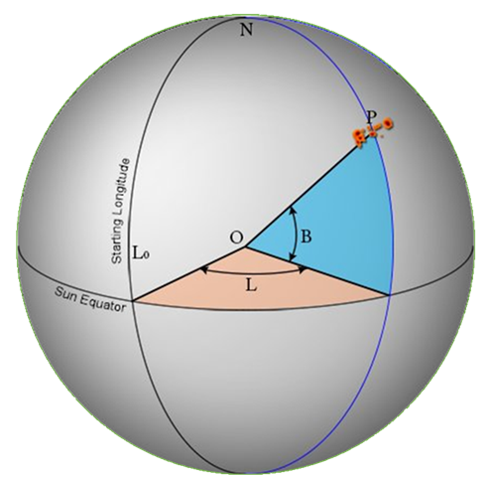
Credits: Cakmak, 2018
In the synoptic map below, heliographic longitude is on the horizontal axis (from 0 to 360 degrees) and heliographic latitude on the vertical axis (from -50 to +50 degrees). The area is binned in squares of 10 x 10 degrees. Based on the location of the sunspot region, the number of sunspot groups that emerged in each square is summed and represented by the mentioned color code. Of note is that created this way, the synoptic map is not saying anything on the size or the complexity of the groups. Different synoptic maps, e.g. based on the sunspot area or on the flare production, can be constructed for these purposes. The synoptic map underneath readily shows the dominance of the southern hemisphere throughout the year, with 76 of 132 sunspot groups (57%). However, this is not the reason why we see the near-monthly ups and downs in the sunspot number. This undulating motion is actually due because the Sun currently contains a hemisphere which is fairly active (between longitudes 150 and 340 degrees, aka "active longitudes"), and a nearly dormant one (from 340 till 150 degrees). In the inactive solar half, there appeared only 48 groups of the 132 regions, that's barely one third of the entire sunspot group population of 2021.
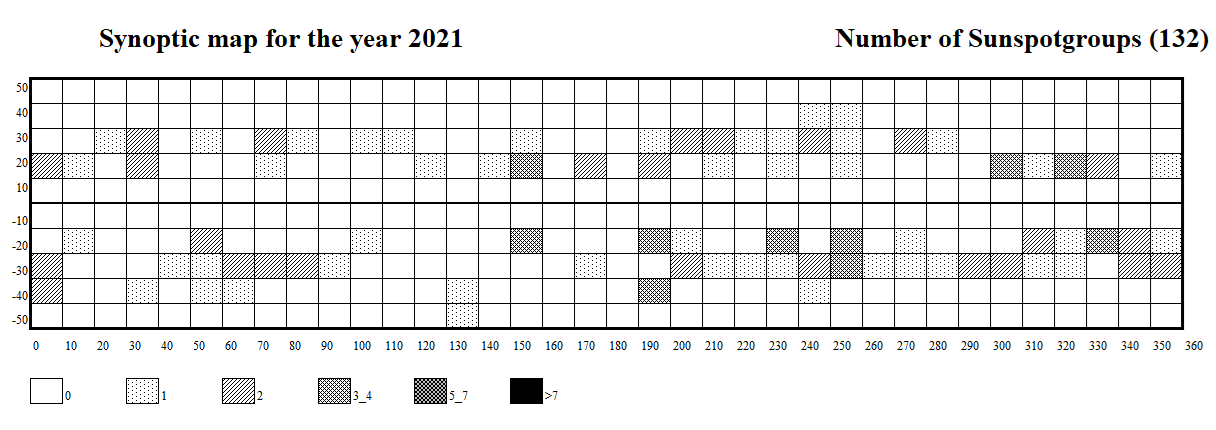
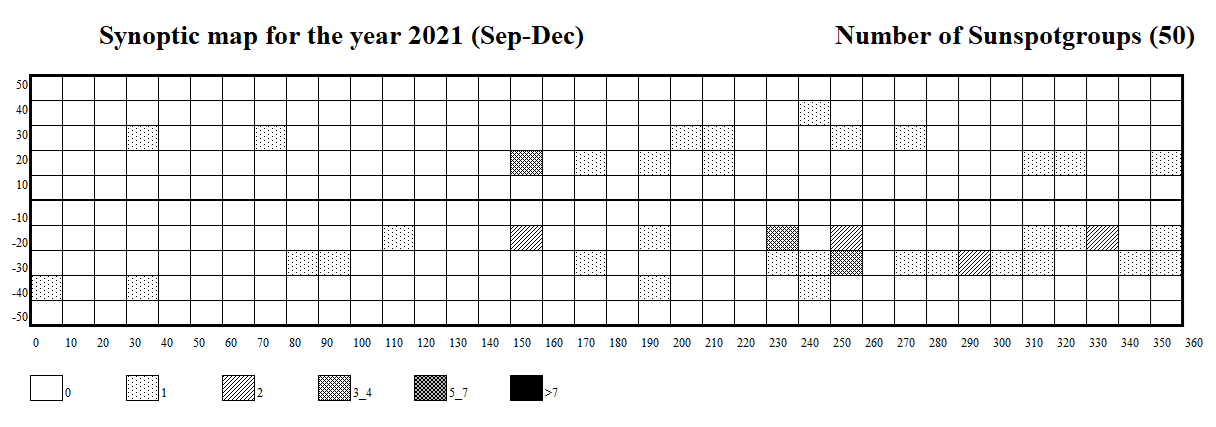
This asymmetry was even more pronounced during the September-December months of 2021 (Carrington rotations 2249-2252), when of the 50 sunspot groups recorded, there were only 11 regions produced by the "calm" solar half (22%). This asymmetry is clear in the synoptic map above. Over the course of its 27-days rotation (as seen from the Earth), the Sun shows every 2 weeks a nearly spotless hemisphere, and 2 weeks later a hemisphere adorned with sunspots. Of note is that the regions that were responsible for the M-class flares in December (see the STCE Newsitem), all emerged in the currently active solar hemisphere. The knowledge of the activity on the two solar faces is also important for long-term predictions of parameters such as the solar radio flux. Nonetheless, at some point this asymmetry will break, as the inactive hemisphere starts producing more sunspot groups, or the active side loses a bit of steam, or both.