
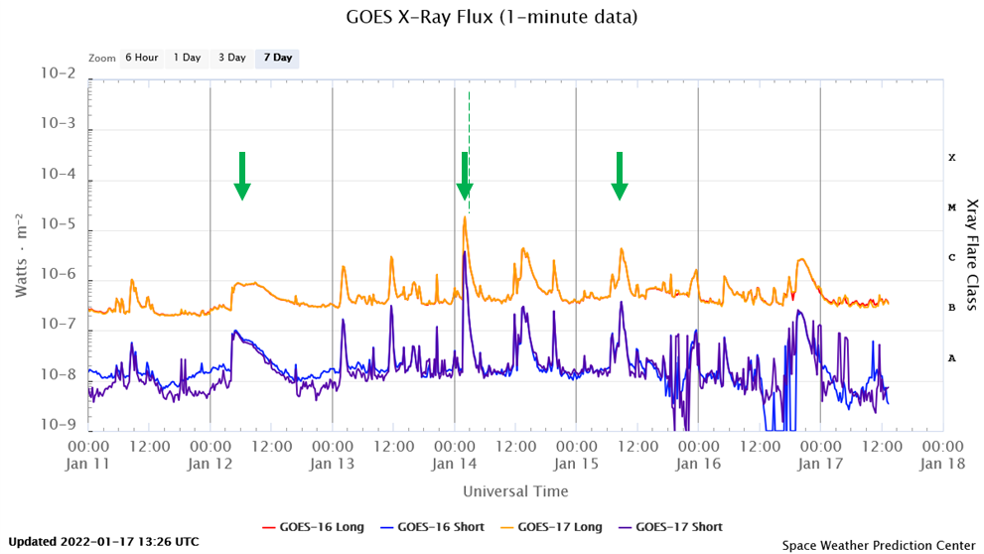
Last week saw again the presence of several sunspot regions which were relatively small and not very active. Meanwhile, from 12 January onwards, an active region behind the northeast solar limb manifested itself in extreme ultraviolet (EUV) imagery by producing several small flares. As the solar disk occulted most of the flaring area, this meant the flares must have been quite a bit stronger than the x-ray peak flux suggested. Underneath is a plot with last week's GOES x-ray flux. The flares from the active region (NOAA 2932 as it eventually got numbered) which are further discussed in this news item are indicated with an arrow. The dashed line indicates the approximate timing when the region started to rotate over the solar limb, about 06UT on 14 January. The clips are from SDO/AIA094, and the stills are from SDO/HMI, SDO/AIA094, and SOHO/LASCO C2.
The region announced itself with a B8 flare while it was still 2 days behind the solar limb. Hence, the true peak flux was certainly higher, most likely an upper M-class flare. There are several reasons for assuming this.
- First, the presence of long-duration post-flare loops with supra-arcade downflows (SADs, see e.g. this STCE news item). These SADs usually only manifest themselves in M-class or stronger events.
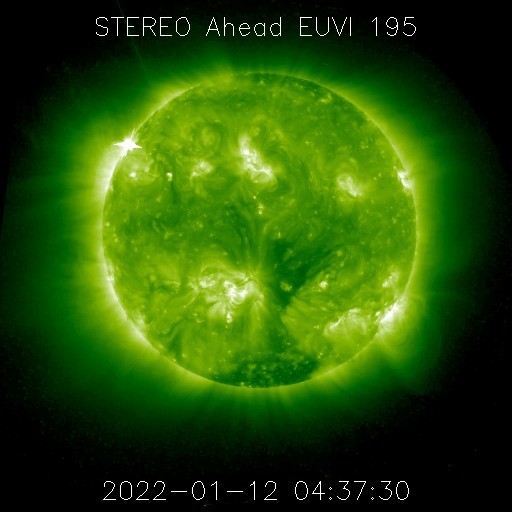
- Second, one can apply the method by Chertok et al. (2015) on the STEREO-A/EUVI imagery. This method is a proxy relating the observed maximum width of the flare's streak in EUV to the GOES x-ray peak of the flare. In this case, the maximum width of the observed streak (around 04:38UT, attached) indicates a peak flux in the M5-M8 range (corrected for the GOES rescaling as outlined by NOAA/NGDC).
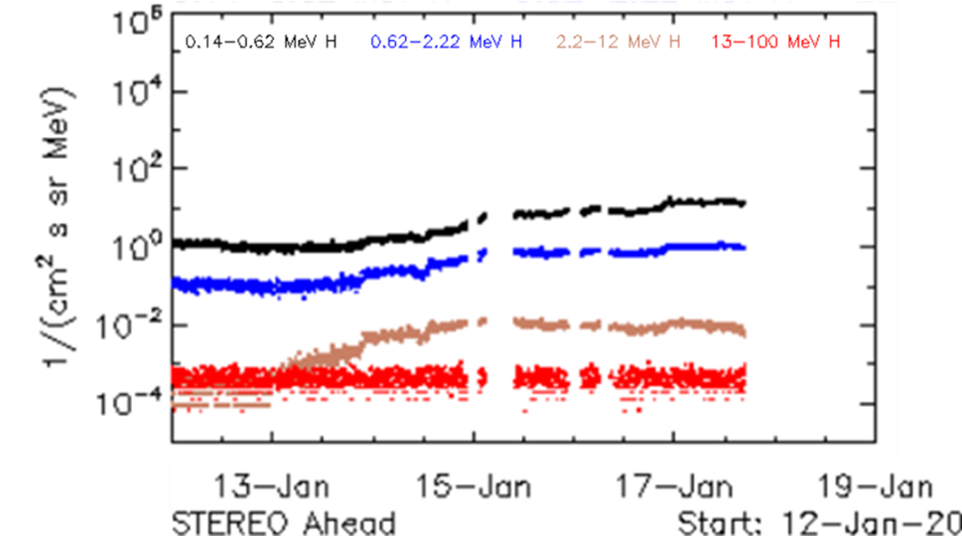
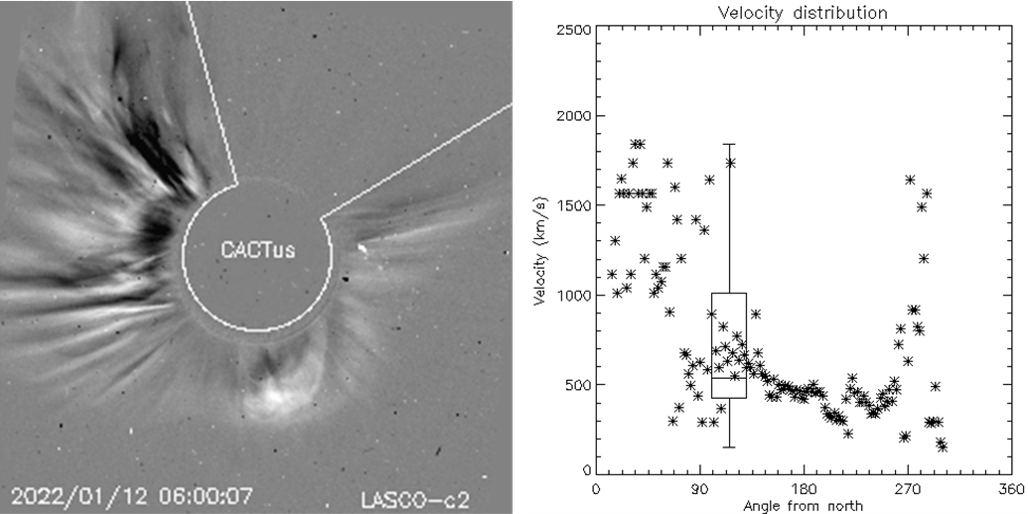
- Then there was the increase in the 10 MeV proton flux by STEREO-A's IMPACT instrument, starting early on 13 January and still in progress around 16 January (see the STEREO webpage, attached). Though the enhancement is rather mild (a factor 10-20 above the nominal background flux), the spacecraft was not favorably connected to the source region as it was located at the Sun's east limb as seen from STEREO-A. So, enhancing the proton flux from that location is quite an accomplishment and testifies of a strong energetic event. Note that the partial halo coronal mass ejection (CME) associated with the eruption had a speed of at least 600 km/s, not so incredibly fast. However, analysis of the coronagraphic imagery seems to indicate that the main portion of the CME (to the northeast) moved considerably faster, most likely with speeds between 1000 and 1500 km/s (CACTus, attached).
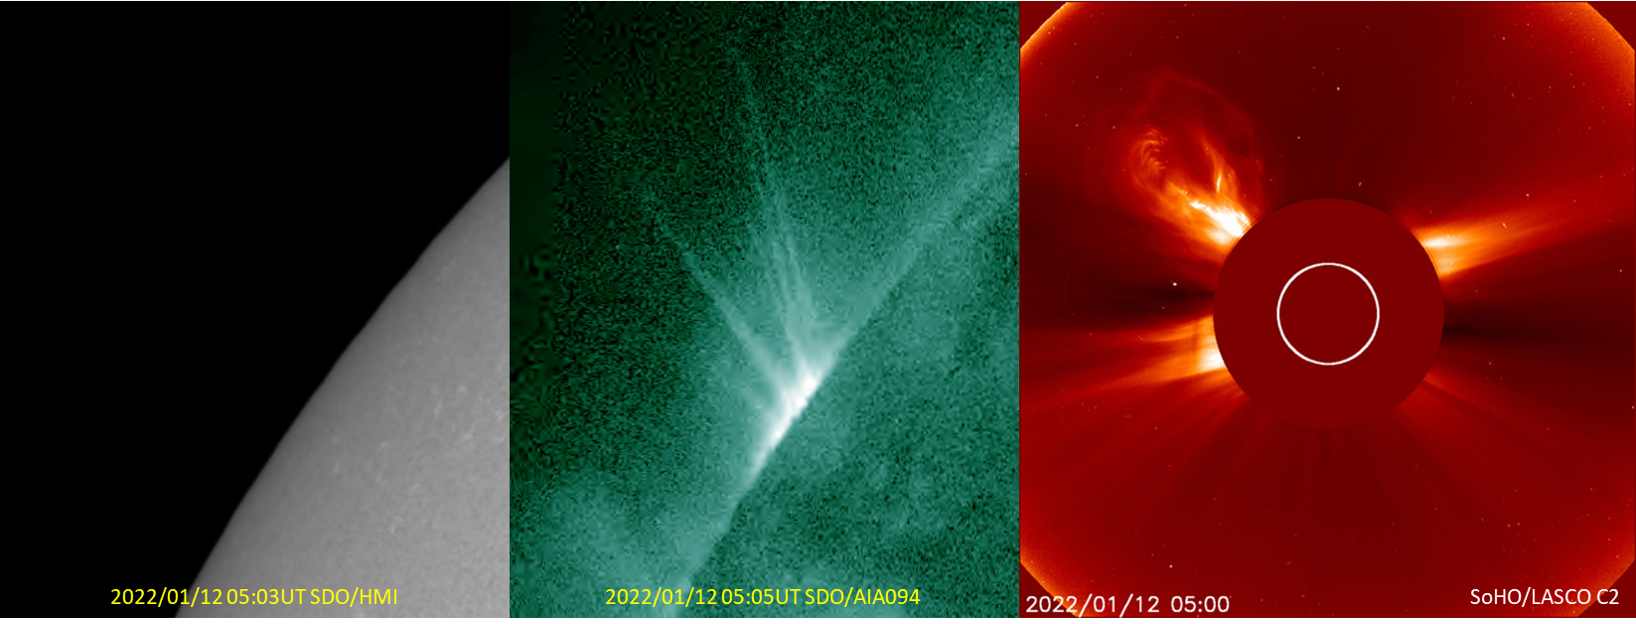
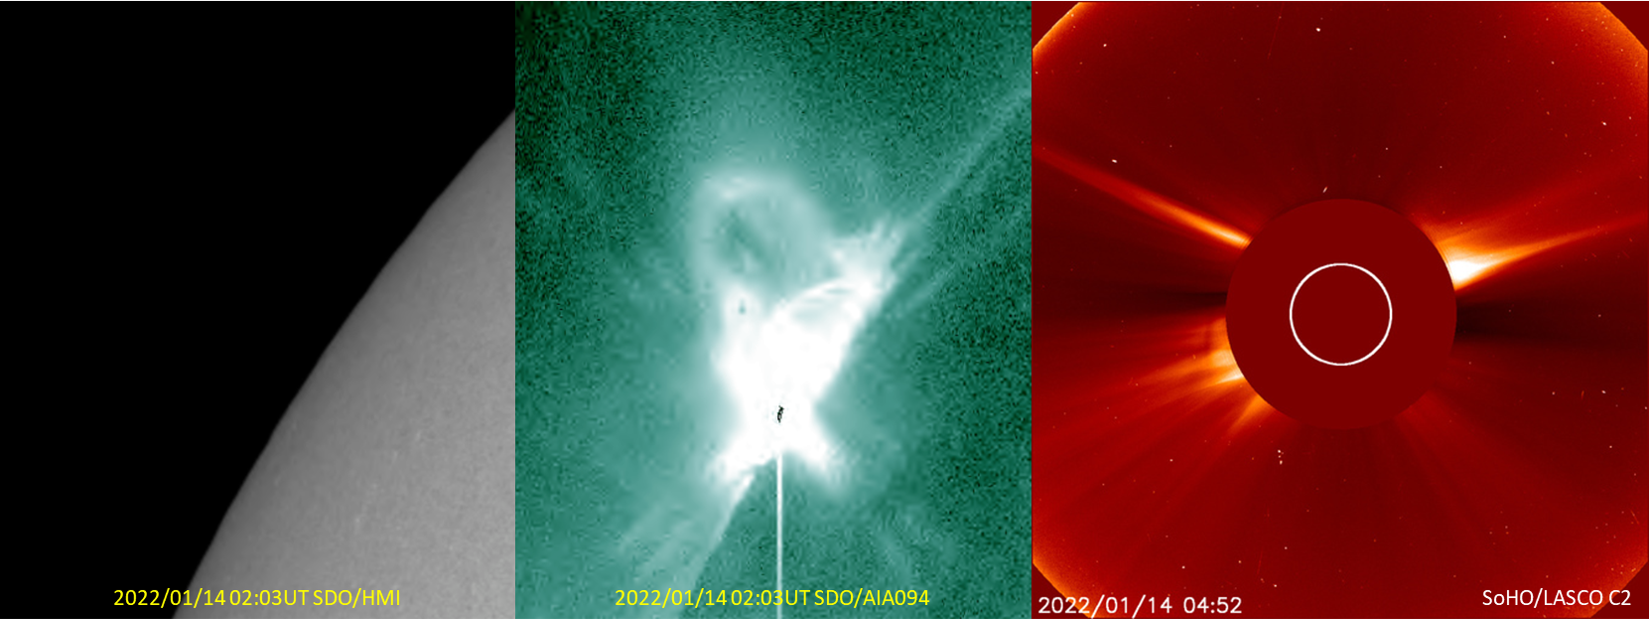
NOAA 2932 produced its strongest flare (that is: as measured by GOES) on 14 January when it was still behind the solar limb, but only barely so because a few hours later the first small spots from this region became visible. The flare peak was M1.8 and reached at 02:03UT. The Chertok methodology indicates that the true strength was not much stronger, between M2 and M3. That is considerably weaker than the 12 January event. There was also no proton enhancement recorded by the STEREO-A spacecraft. Interestingly too, the associated CME had a completely different outlook, and was quite narrow (jet-like), suggesting changes in the magnetic topology of the region.
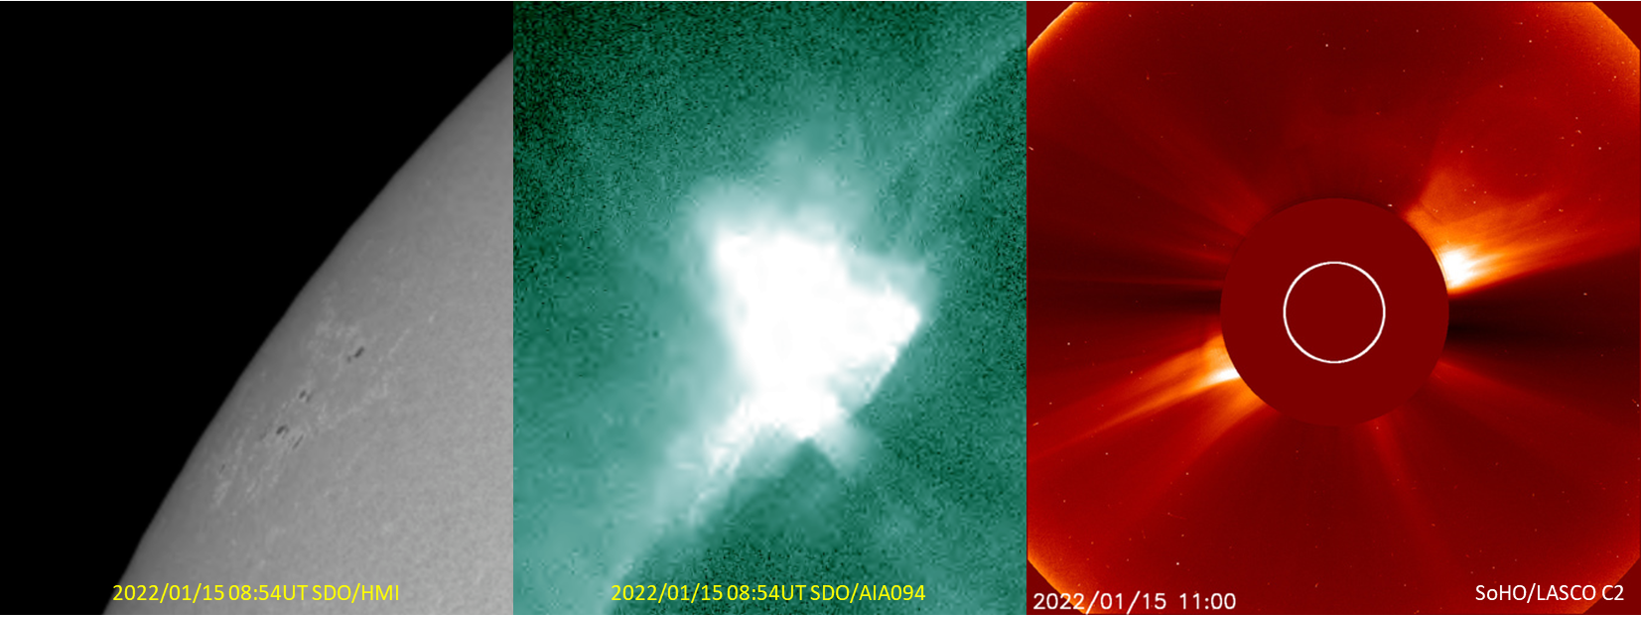
The strongest flare while NOAA 2932 was visible on disk was a C4 flare on 15 January. By that time, it was clear the sunspot region was not very complex and had simplified considerably from what it probably was a few days before, with only some small spots remaining. No obvious CME associated with the eruption was observed. The region further decayed and became spotless on 18 January, crushing all hopes to have fireworks similar to the week before. Maybe better next time.
