
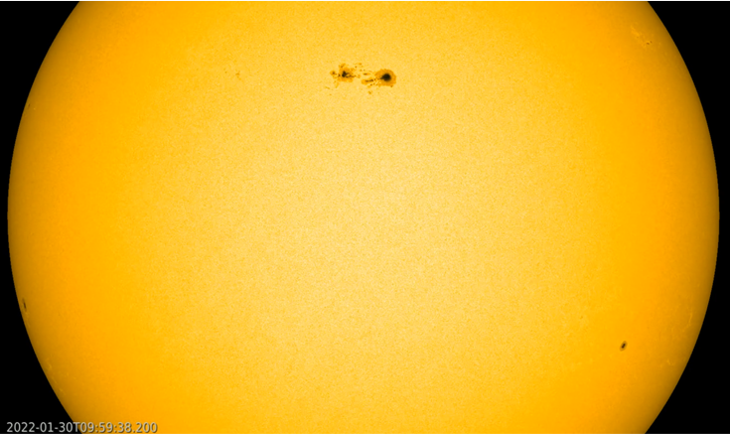
NOAA 2936 rounded the northeast solar limb on 24 January and was numbered by NOAA the next day. The group gradually gained in size, and eventually reached a sunspot area about 4 times the surface area of the Earth, thus becoming the 3rd largest group of solar cycle 25 (SC25) so far, after NOAA 2786 and NOAA 2835. Using eclipse glasses, several solar observers reported the group visible to the naked eye when it was near the Sun's central meridian around 30 January. SDO/HMI imagery underneath shows the evolution of this active region from 25 January till 4 February.

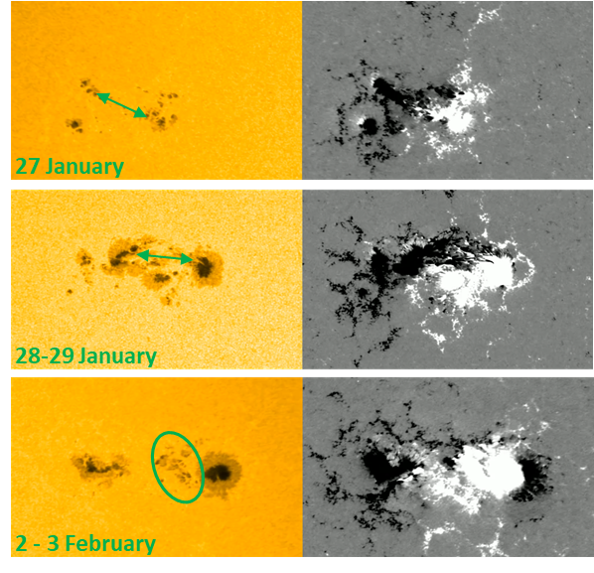
There were 3 major episodes of magnetic flux emergence (i.e. sunspot formation) during NOAA 2936's transit, as shown in the annotated imagery underneath, with white light images on the left and magnetograms on the right. In magnetograms, white denotes positive magnetic polarity, or areas where the magnetic field is leaving the Sun, and black represents areas where the magnetic field is returning to the Sun (negative polarity). A first but brief period of flux emergence took place in the southeast ("lower left" in the images) of the region on 27 January. It was quickly followed by major flux emergence to the north of the leading spot on 28 and 29 January. This 2nd flux emergence contributed significantly to the growth of the two main spots. A final episode of sunspot formation took place on 2 and 3 February, to the east ("left") of the main leading spot. This new flux had mostly the same magnetic polarity as the main sun spot ("white" in the magnetogram). Despite its size and apparent complexity in white light, the sunspot group had all in all a quite simple magnetic configuration with mostly some magnetic mixing along the polarity inversion line (the "border" between positive and negative magnetic fields). This resulted in numerous but relatively weak solar flares, with NOAA counting more than 50 C-class flares and only one M-class flare in this region during its transit.

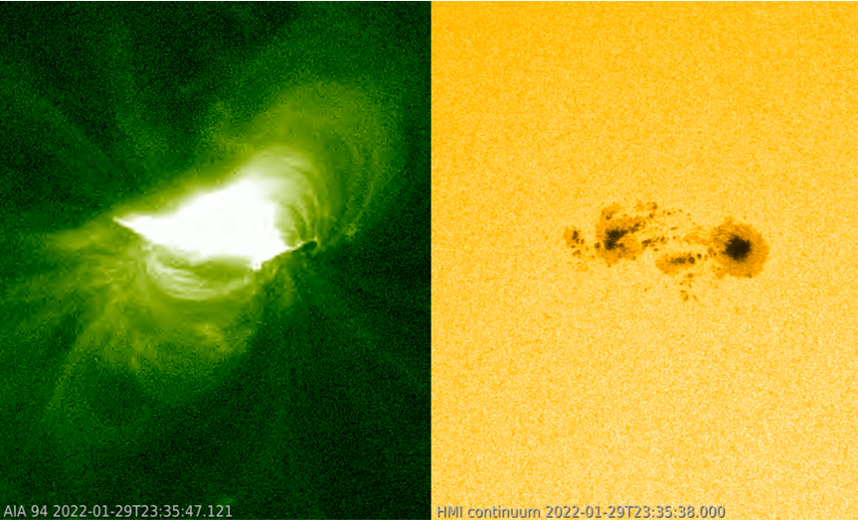
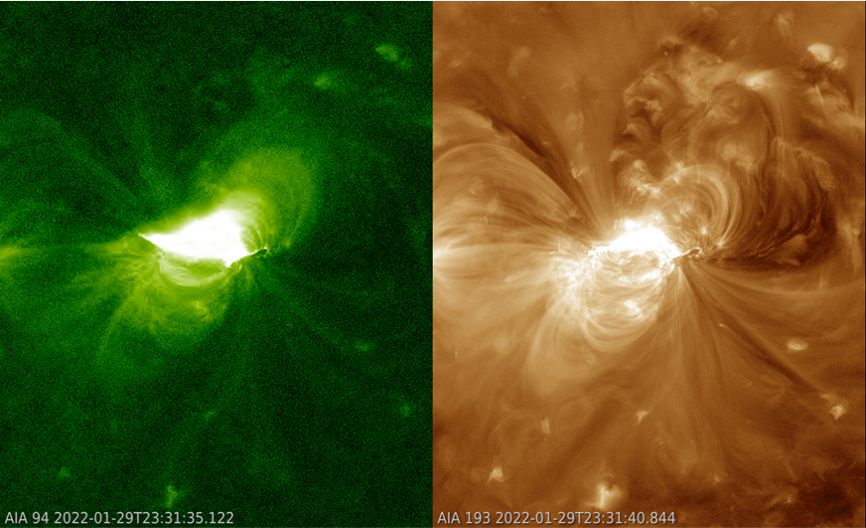
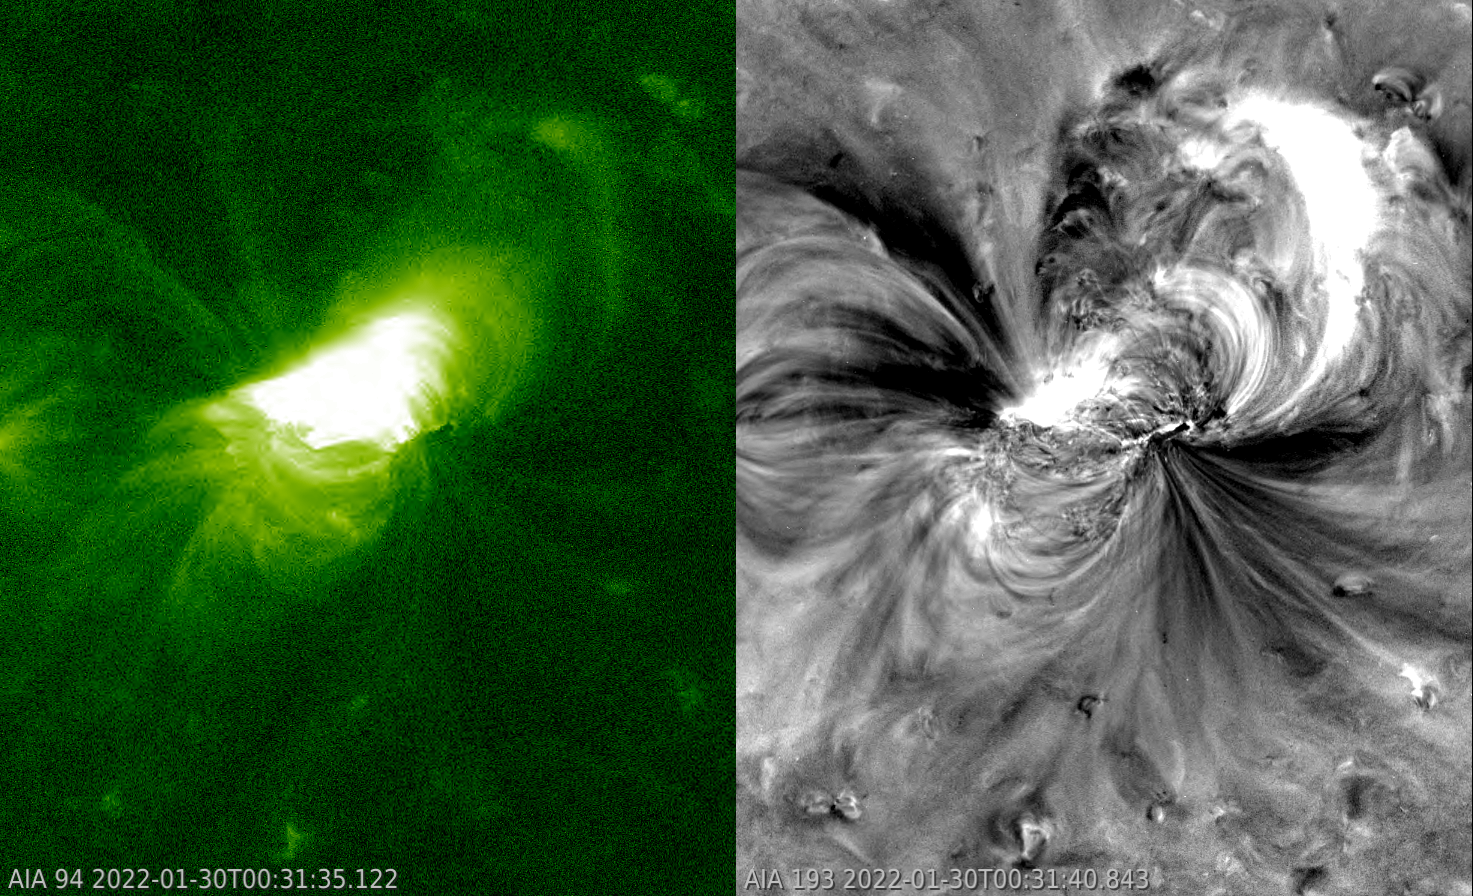
The strongest flare in NOAA 2936 took place late on 29 January. It was a long duration M1.1 flare peaking at 23:32UT, and drove the 10.7 cm radio flux from its background values around 125 sfu (solar flux unit, 1sfu = 10-22 W m-2 Hz-1) all the way up to 320 sfu (a "Tenflare"). The associated coronal mass ejection would arrive at Earth late on 1 February and cause some minor geomagnetic storming. The imagery underneath first shows the size and location of the flare in AIA 094 (multi-million degrees ; left) relative to NOAA 2936 (white light ; right ; overlay), then (somewhat zoomed-out) against AIA 193 imagery (1.25 million degrees ; left). The latter shows very well some coronal dimming mainly to the northeast (the "darkening" in the upper left ; difference image) of the region, as well as the development of post-eruption coronal loops.


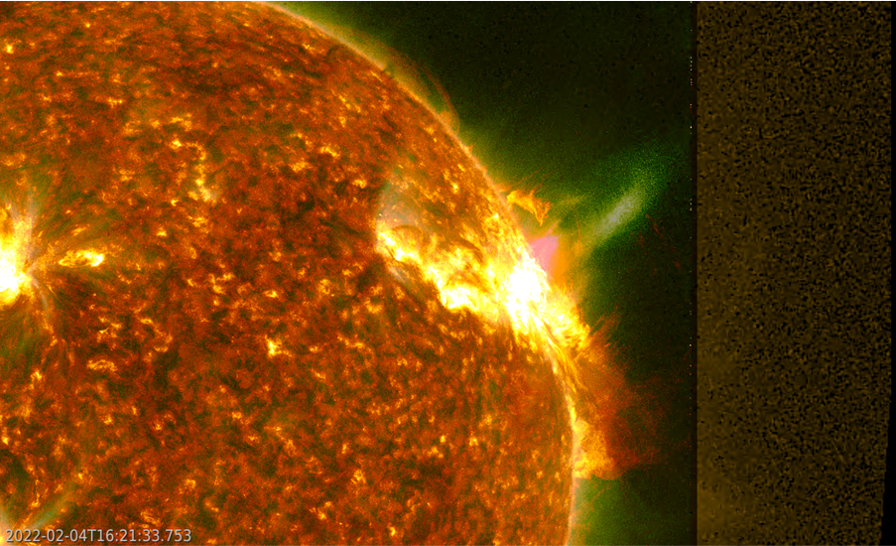
As the region neared the northwest solar limb, it remained quite active and continued to produce several C-class flares. The imagery underneath covers the period 4-5 February, with AIA 304 images (red) overlaid on AIA 094 (green) and PROBA2/SWAP (yellow) images. AIA 304 depicts mainly "cool" temperatures around 80,000 degrees, whereas SWAP 174 shows the solar atmosphere at temperatures near 1 million degrees, and much further away from the Sun. It also allows to follow the eruption as the Sun gets eclipsed by the Earth as seen from SDO, and no SDO/AIA images are available. The most dynamic eruption occurs on 4 February between 15 and 17UT (C5.8 flare), faintly extending in the outer portions of SWAP's field-of-view. The green towering loops in the background were only visible in AIA 094 and SWAP 174. They do not seem to be associated with this event, but rather originate from an energetic eruption beyond the solar limb around noon on 4 February.

Credits: Movies and pictures were created with JHelioviewer.
