
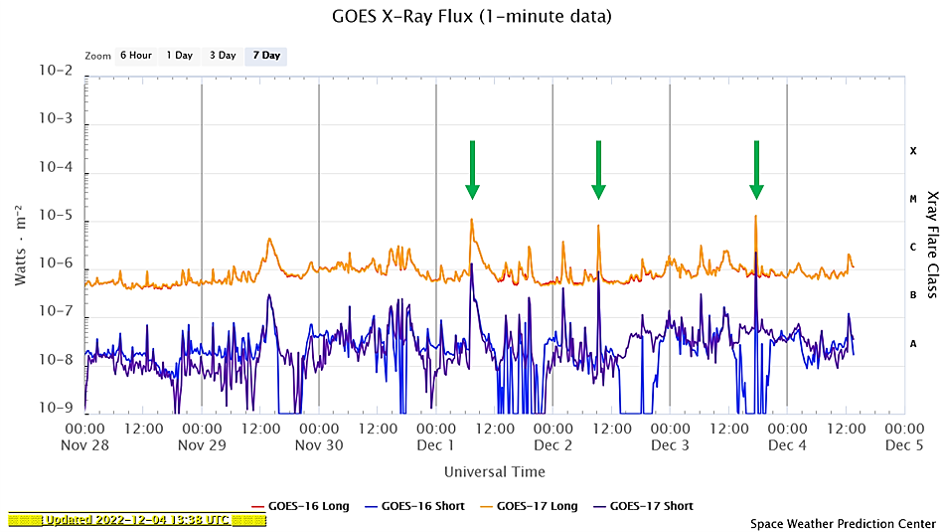
Last week's solar activity was characterized by a number of interesting solar flares. An M1 flare was recorded on 1 December at 07:21UTC, a C8 flare took place on 2 December peaking at 09:20UTC, and another M1 flare was observed on 3 December at 17:41UTC. The flares are indicated in the graph underneath, displaying the soft x-ray (SXR) flux measured between 0.1 and 0.8 nm by the GOES-17 satellite (the orange curve).
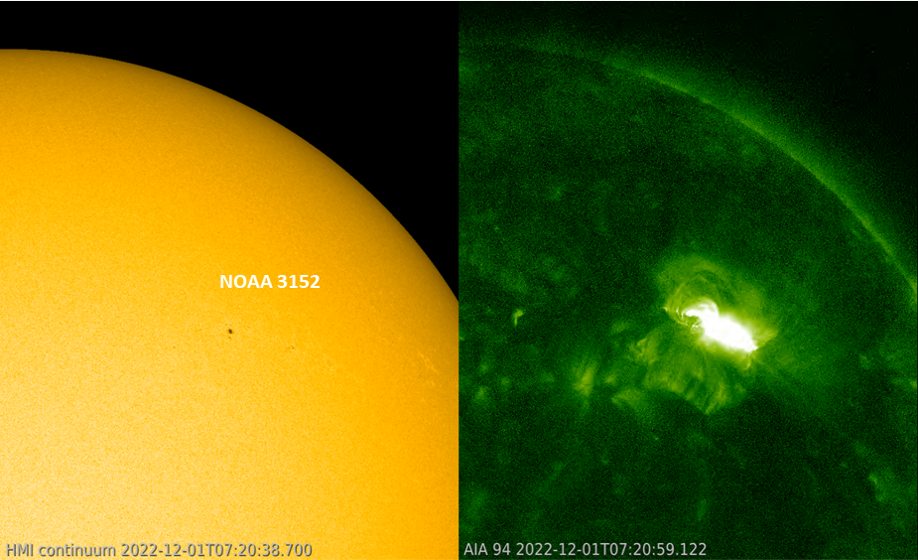
The first M1 flare was also the most complex of the three eruptions, with post-flare coronal loops being visible for several hours after the SXR peak. As can be seen in the imagery underneath, it took place in a small and decaying sunspot region (NOAA 3152) that seemed to have a fairly simple magnetic configuration. Though it is well known that eruptions can take place in decaying active regions, it's a whole different story to predict if a flare will occur and how intense it will be. The SDO images underneath display the Sun in white light (left) and in extreme ultraviolet (EUV) at a wavelength of 9.4 nm (AIA 094 ; right), showing the solar corona at a temperature of several million degrees. Each clip covers 6 hours, with a cadence of one image every 3 minutes.
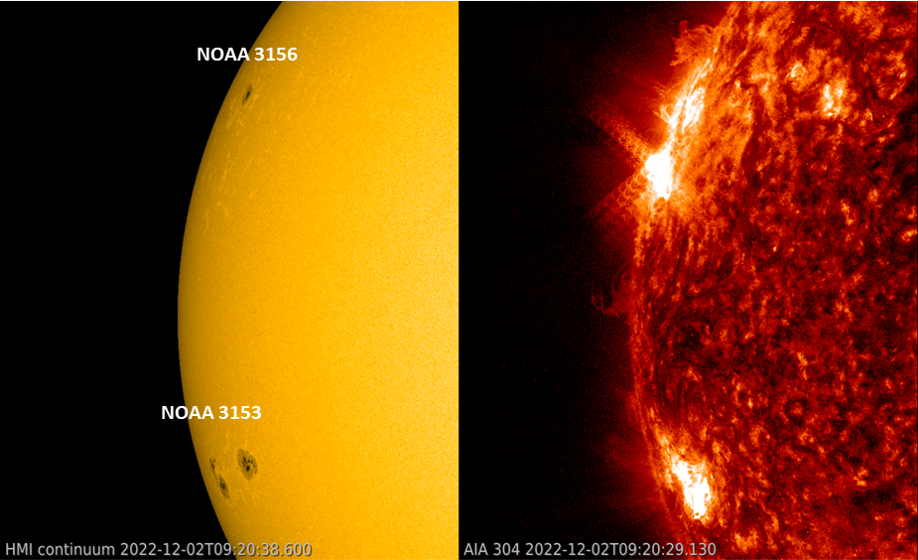
The C8 flare originated from near the northeast limb. It was not so easy to determine which sunspot group was the source location of the event, as EUV imagery indicated that its location was to the south and east ("left") of NOAA 3156, but apparently still in front (to the west or "right") of NOAA 3157 that still had to round the solar limb at that time. The SDO imagery underneath shows the eruption at temperatures around 80,000 degrees (AIA 304 ; right), and the view in white light on the left. NOAA 3156 is the spot to the north, NOAA 3157 is not visible yet.
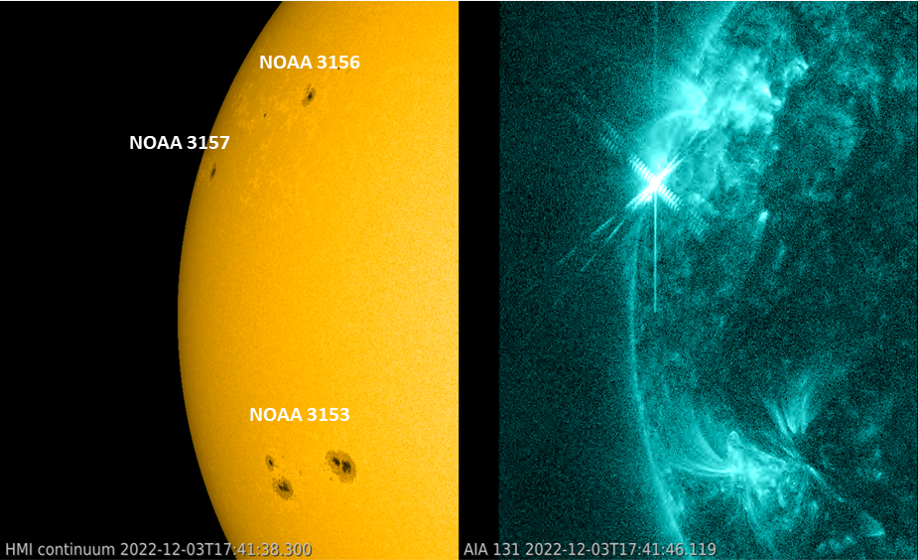
The second M-class flare originated from the same area, but this time apparently from the trailing portion of NOAA 3157 (the sunspot closest to the limb), as can be seen in the SDO imagery underneath. The image to the right is again in EUV, but this time the filter (AIA 131) displays both the hot parts in the Sun's upper atmosphere (corona) at several million degrees, as well as some cooler parts around 400.000 degrees. To the left is a white light image. The flaring event didn't last 10 minutes, and so this impulsive M1 flare barely shows in the clip. The screenshot shows blooming and some diffraction patterns, the origins of which are explained in this STCE news item (Note 1).
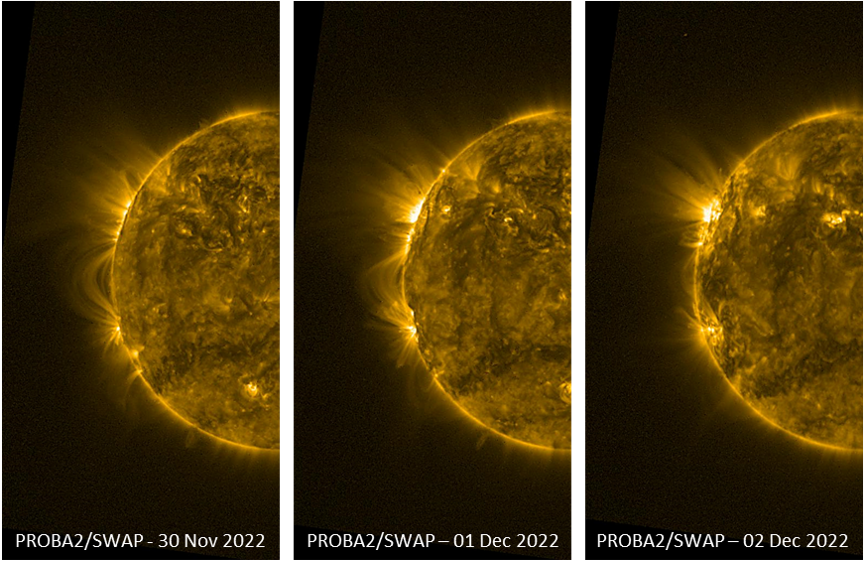
Meanwhile, the big sunspot group NOAA 3153 on the southern solar hemisphere remained relatively quiet, producing only a few low-level C-class flares so far. The region seemed connected by a series of trans-equatorial coronal loops to its counterpart on the northern solar hemisphere NOAA 3157 and surroundings. The PROBA2/SWAP images show the structure as the active regions rotate over the east limb from 30 November to 2 December. These loops are of interest to the solar physics community, for example in determining the plasma properties in the outer corona (see e.g. Zaqarashvili et al. 2013).
