
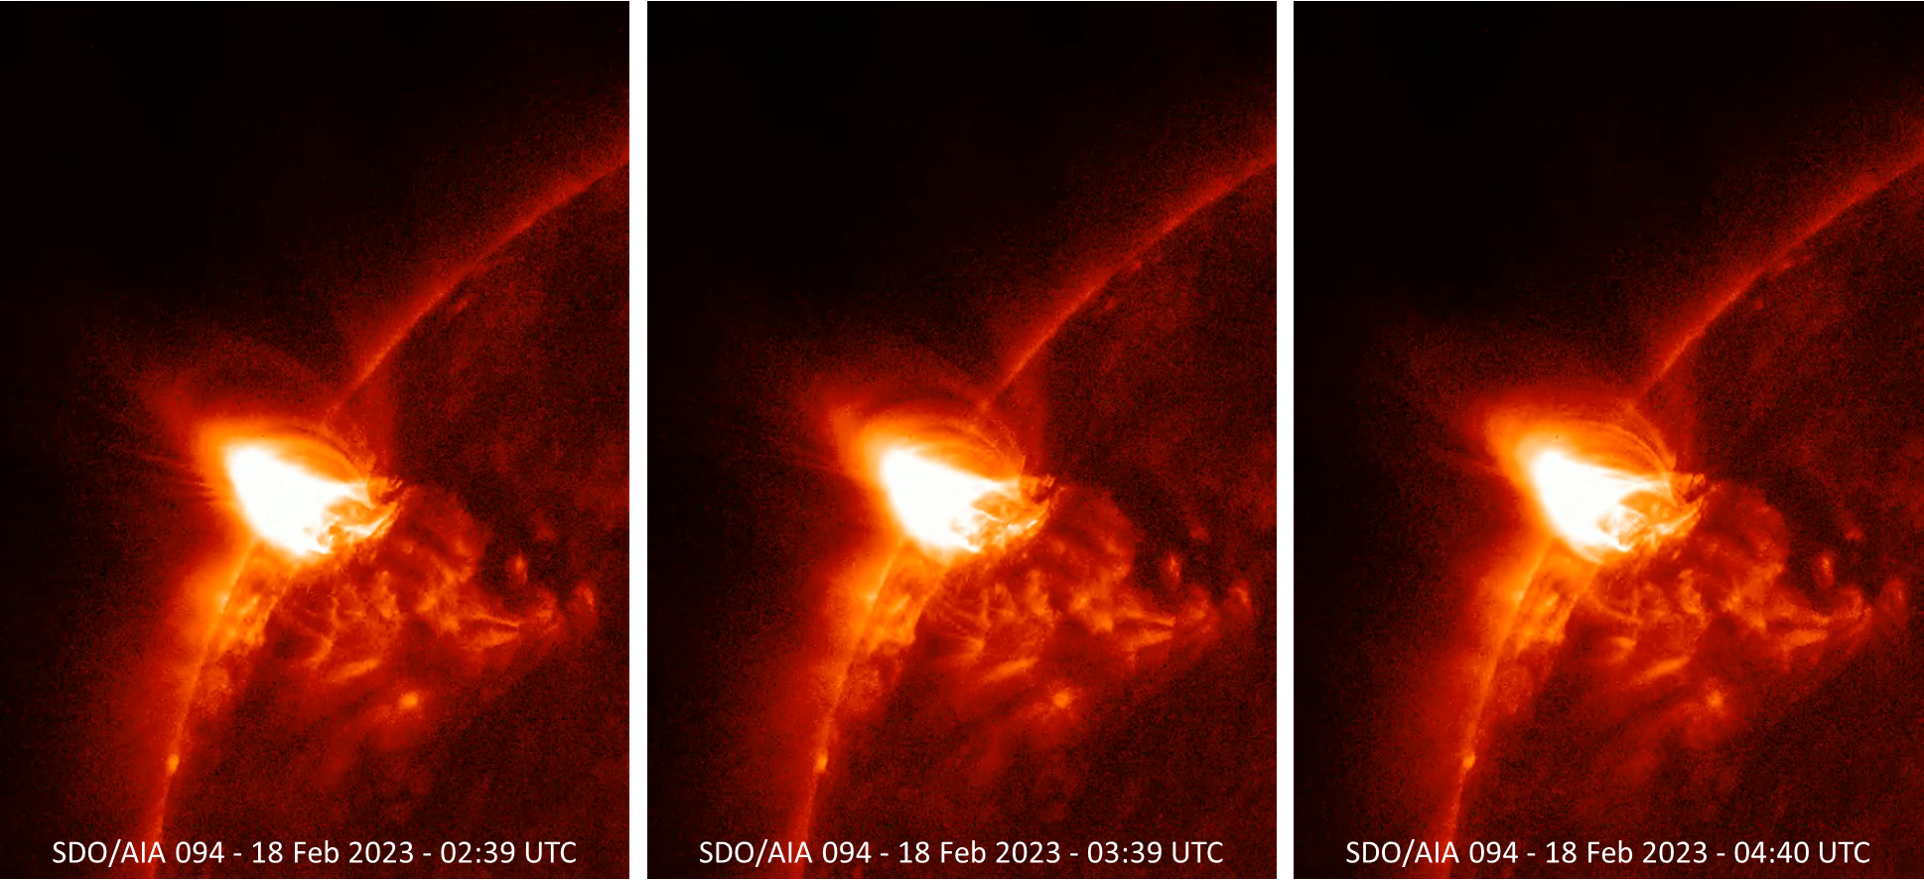
The X2 flare from 17 February has already been discussed in the news flash. The associated coronal mass ejection (CME) arrived as expected by the SIDC forecasters early on 20 February. As it was only a glancing blow, geomagnetic activity remained limited to unsettled (K_BEL) and active (Kp) levels. It took a day and a half for the solar soft x-ray (SXR) emission to return to background levels (GOES), highlighted in the SDO extreme ultraviolet imagery (EUV) underneath showing side-by-side clips of the event at temperatures of multi-million degrees (SDO/AIA 094 ; left)) and around 700.000 degrees (SDO/AIA 171 ; right). The clip covers the period of 17 February at 17:30 UTC until 20 February at 10:30 UTC (so 41 hours!), and was created with Space Weather JHelioViewer (SWHV). This tool also allows the integration of timelines such as, in this case, the GOES SXR data.
In another clip, the AIA 094 images have been overlaid onto a white light image of the Sun (grey ; SDO/HMI) thus showing the position and evolution of the flare and its footpoints relative to the sunspots in active region NOAA 13229.

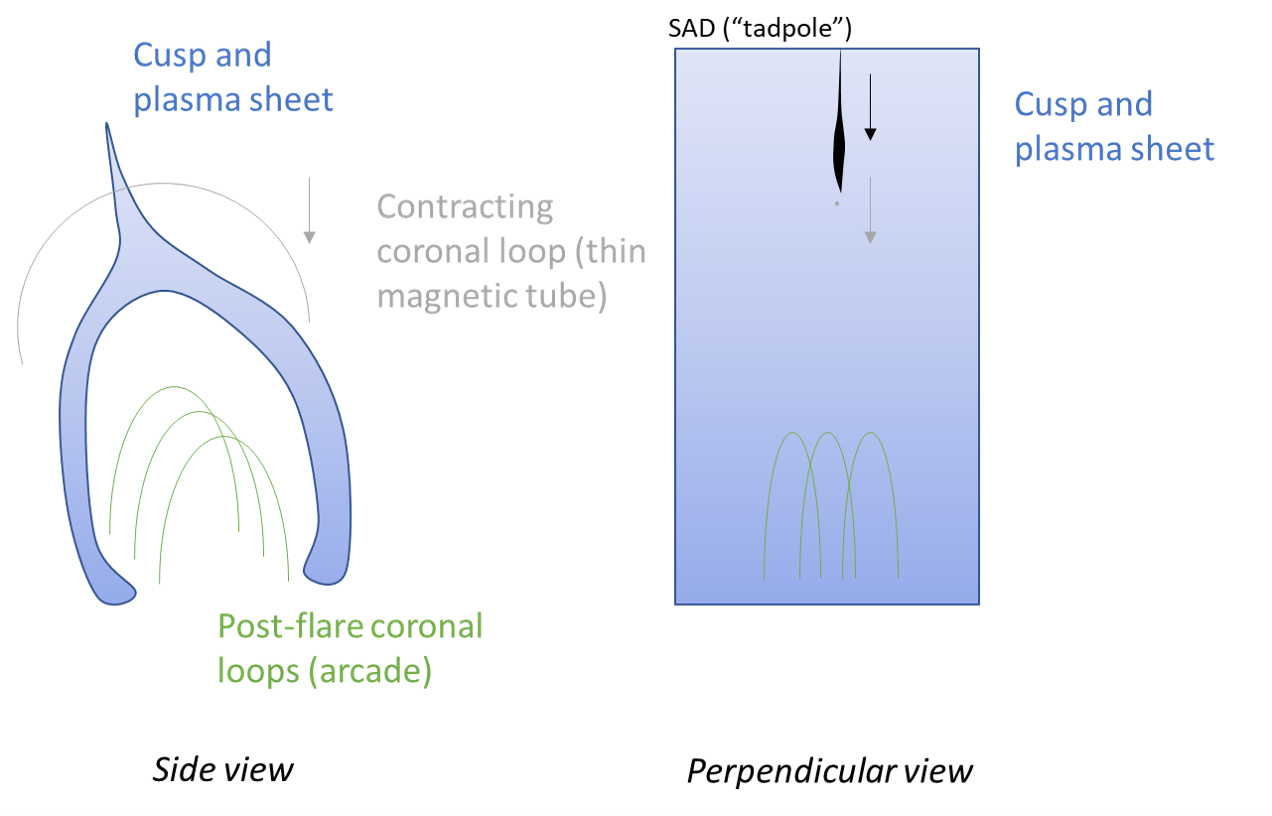
Noteworthy in all of the AIA 094 clips (EUV) was the cusp ("flame-like") structure that can be seen over the blast site. Cusps were first discovered by the Yohkoh satellite in soft x-ray images during the 1990s (e.g. Shibata 1998), thus confirming and finetuning the standard solar flare model. A cusp is a very hot structure usually only visible in soft x-rays or energetic EUV passbands such as AIA 094 (9.4 nm), and not in higher passband filters such as AIA 193 (19.3 nm) or AIA 171 (17.1 nm). It indicates that magnetic reconnection took place and that the eruption was associated with a CME. Also visible in the EUV clips are a series of contracting coronal loops (Hudson 2000). It is believed they are associated with another impressive feature sometimes observed during strong solar flares, the supra-arcade downflows (also known as "SADs" or "tadpoles", see e.g. the STCE newsitems here and here). Those SADs are not visible in the above clips as we are looking "sideways" at the eruption, whereas in order to see the SADs a perpendicular viewpoint is required. One of the explanations of SADs and contracting coronal loops is that SADs are actually wakes (i.e., trailing regions of low density) created by the retraction of much thinner magnetic tubes through the supra-arcade plasma (e.g. Savage et al. 2012 ; see sketch). The figure underneath shows a slow-moving contracting coronal loop, the clip contains many more and faster moving examples. There's still much work to be done in this field of solar physics, but events like this one certainly help to get to the heart of the matter.
