
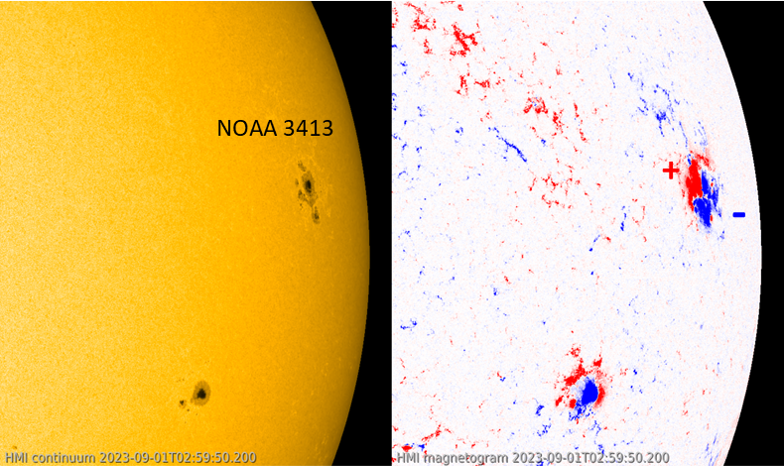
NOAA 3413 was a unipolar sunspot group, i.e. consisting of mainly positive magnetic polarity, for most of its transit over the solar disk. However, late on 28 August, the situation became more interesting with the gradual emergence of opposite magnetic polarity flux south and southwest of the main sunspot. This can be seen in the SDO-imagery with on the left a white light image showing NOAA 3413 and on the right red and blue patches indicating areas of resp. positive and negative magnetic polarity, i.e. areas where the magnetic fields are leaving resp. returning to the solar surface. The clip shows the evolution of this sunspot group on 31 August and 1 September (annotated image).
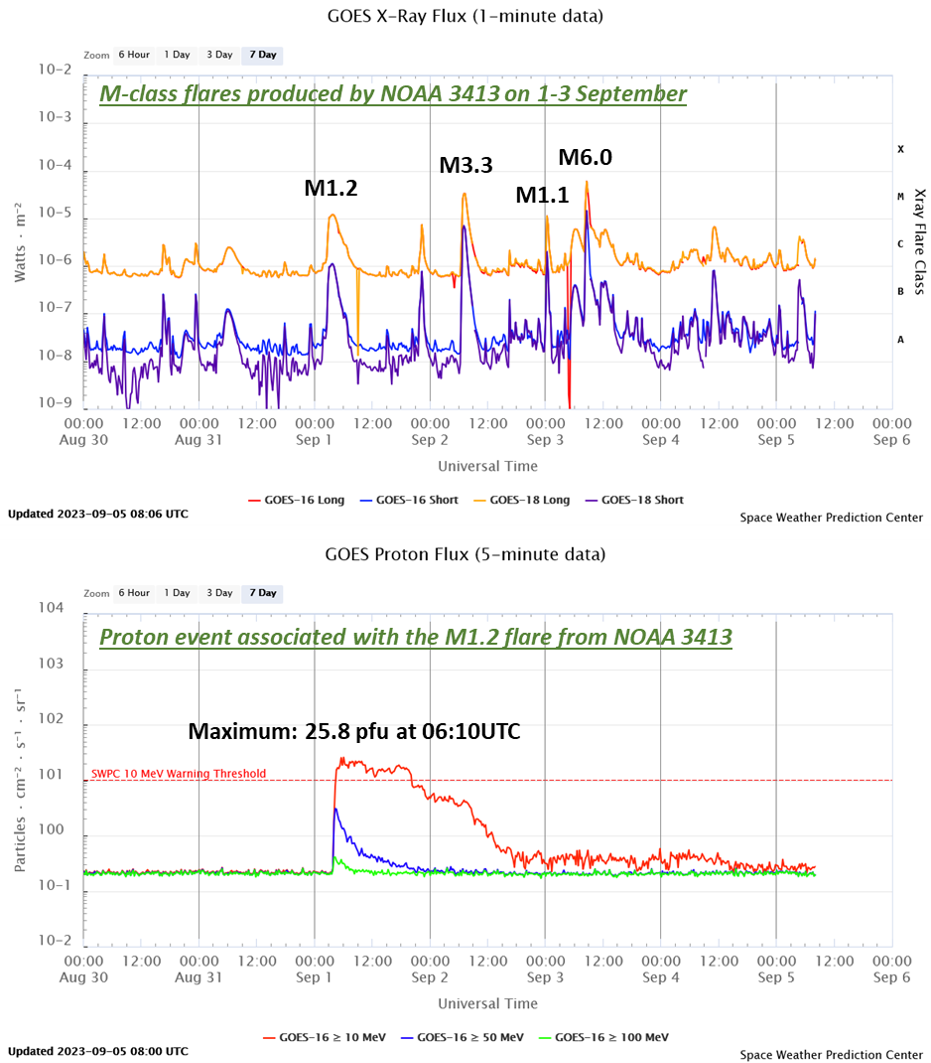
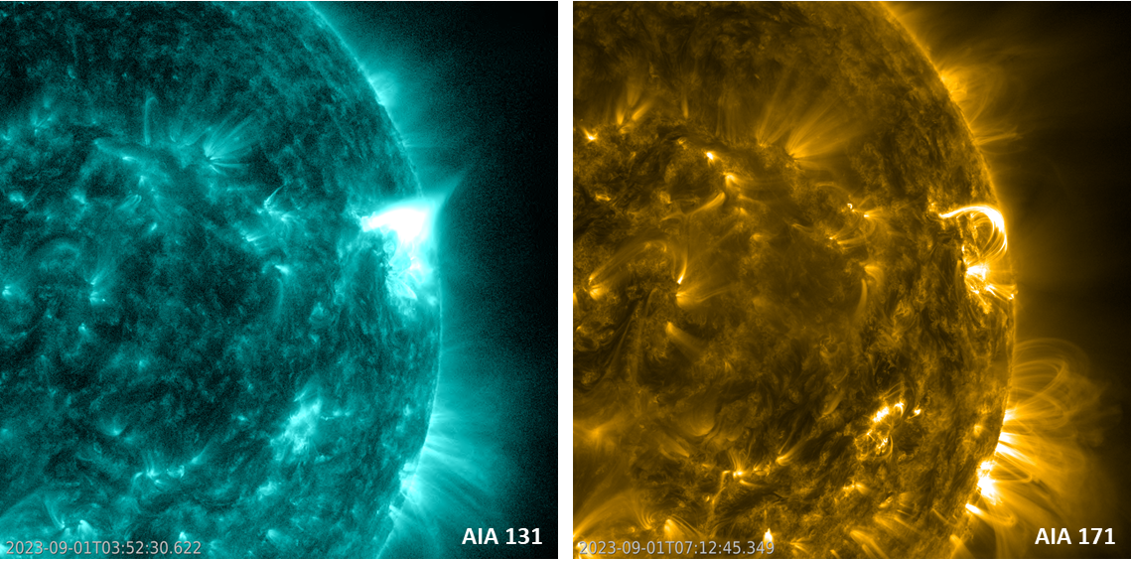
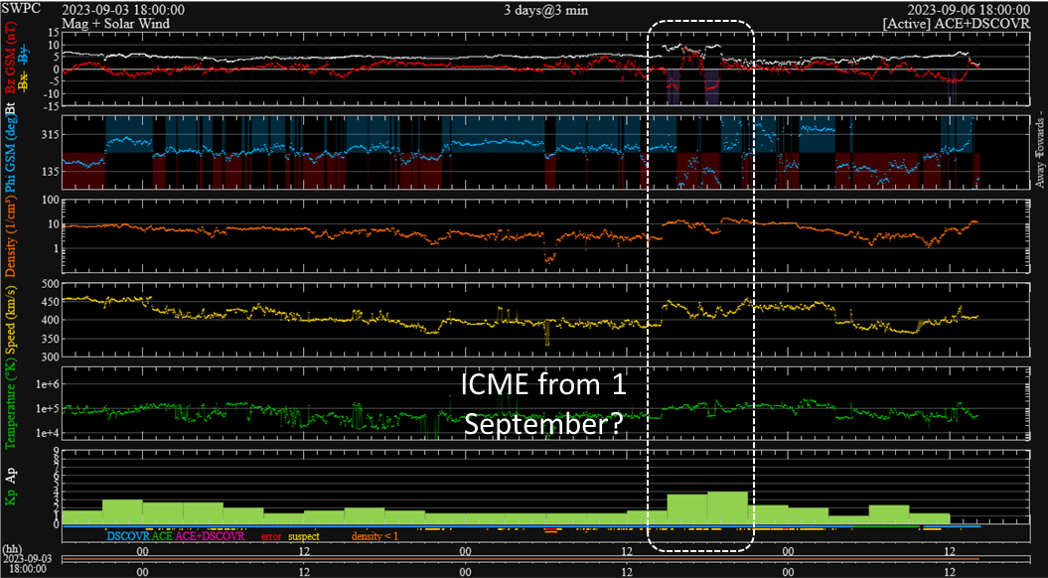
The close proximity of these opposite polarity fluxes kicked off a series of M-class flares, starting with a long-duration M1 flare peaking early on 1 September at 03:51UTC (GOES). Extreme ultraviolet (EUV) imagery such as AIA 094 and 131, i.e. at high temperatures of several million degrees, showed an impressive candle-flame-like structure over the source region. This is called a "cusp", and is indicative of the magnetic reconnection that has taken place and also implies that material has been ejected into space. The images underneath show the cusp (AIA 131) around the time of maximum x-ray flux (left), and the post-flare coronal loops developing a few hours later (AIA 171, temperature around 700.000 degrees ; right - still image). A coronal mass ejection (CME) was indeed observed but thought to have only a small chance to deliver a glancing blow to the earth environment. Nonetheless, solar wind data (DSCOVR - annotated graph) reflect a weak shock around 14:40UTC on 5 September, suggesting the late arrival of the 1 September CME.
 |
 |
The M1 flare was also associated with a small proton event (annotated graph underneath, combined with the soft x-ray curve) that reached a maximum flux of 25 pfu at 0610 UTC, and ended the same day. Any space weather effects from this minor solar radiation storm (S1 - see the NOAA scales) were limited to minor degradation of High Frequency communications in the polar regions. The more energetic proton fluxes (green curve) got barely enhanced and remained mostly at background levels. There have been already over 10 minor and 2 moderate proton events this year.
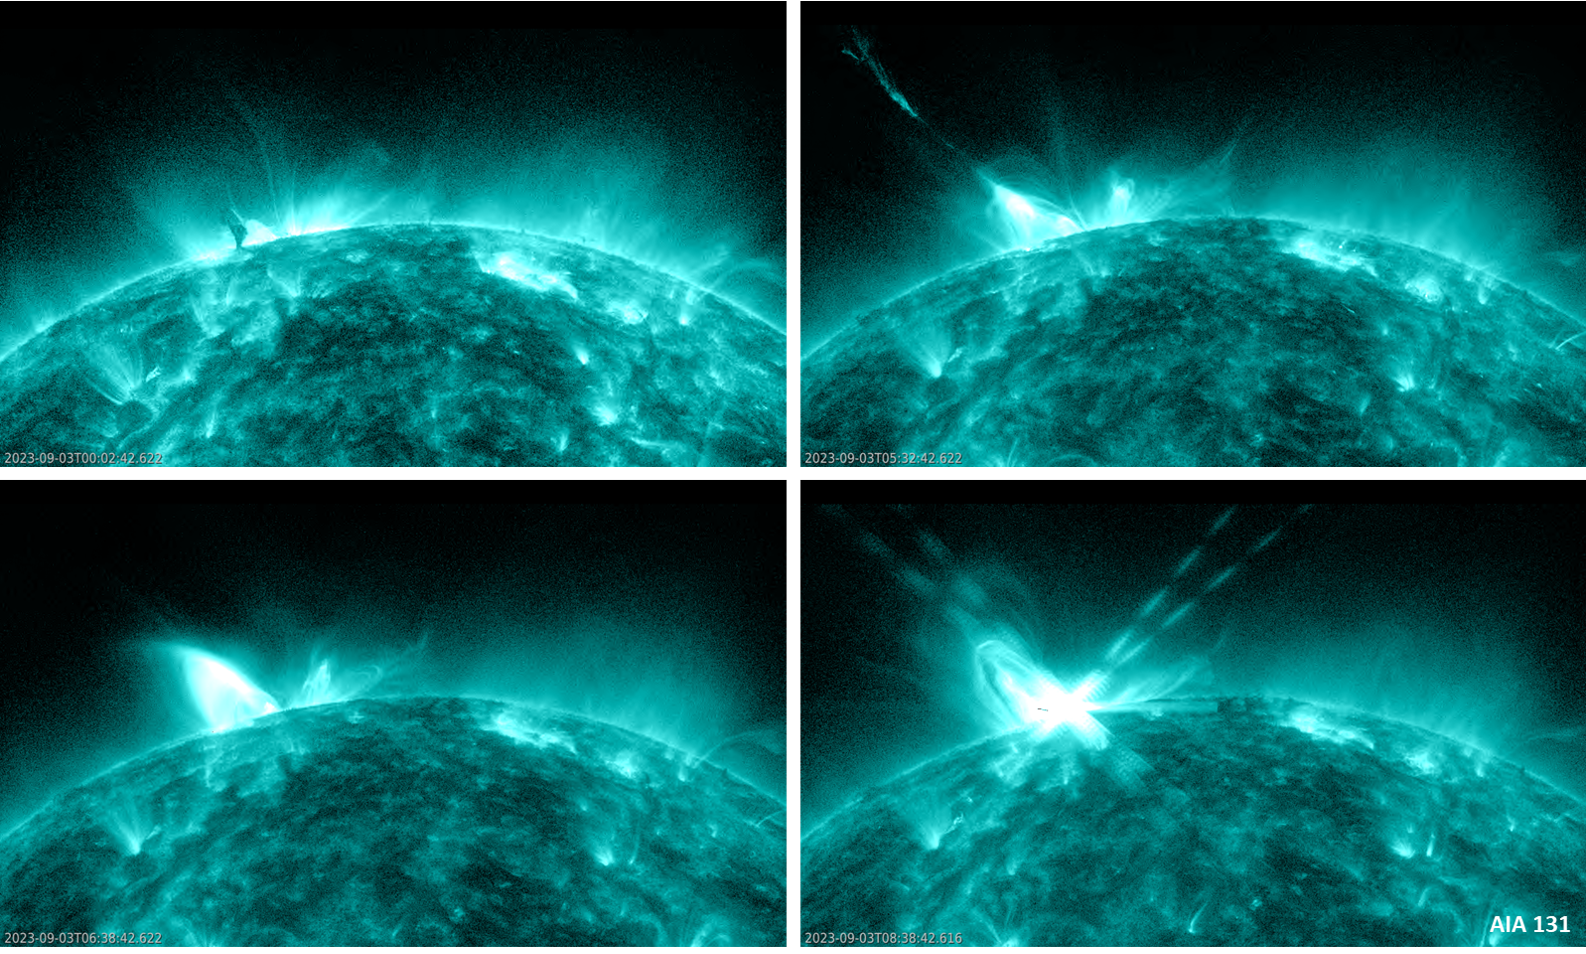
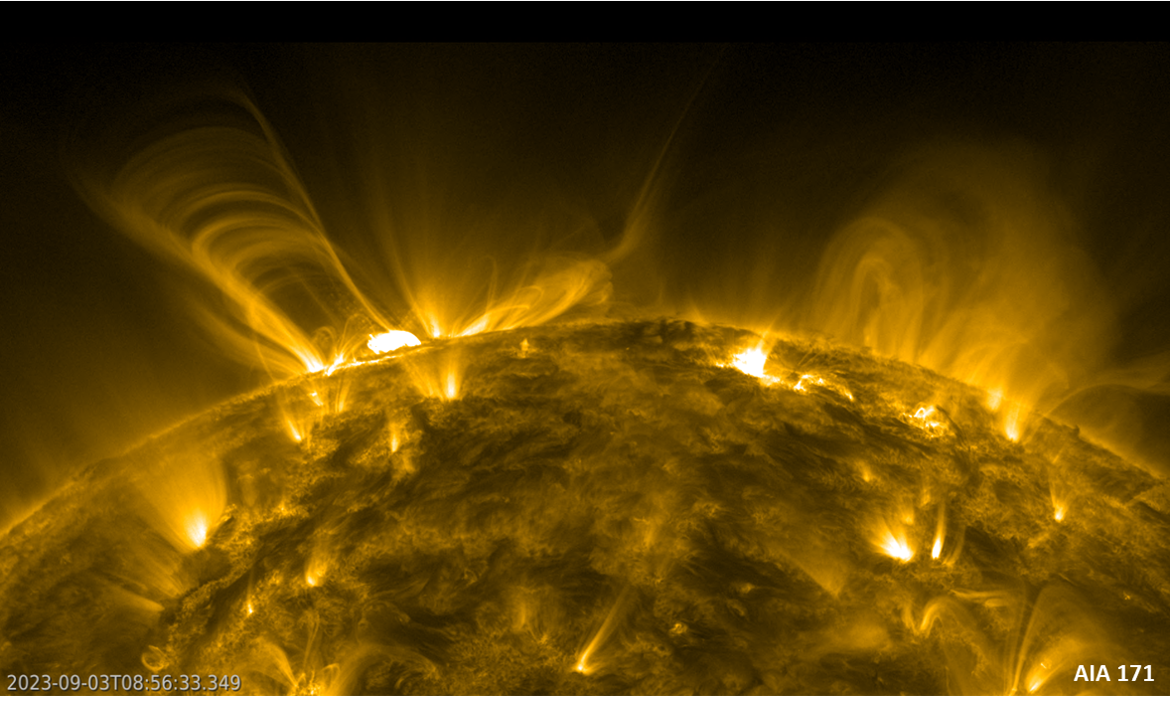
The imagery underneath shows the eruptive activity from NOAA 3413 on 3 September, including the M6 flare that peaked at 08:36UTC. Note the solar image is rotated over 90 degrees, with west now on top and north to the left. The clip covers 16 hours, at a cadence of 1 image every 3 minutes and played at 20 images per second (so 320 images in 16 seconds). The compilation underneath shows AIA 131 imagery of the eruptive activity that is going on during that period. Note that the AIA 131 filter has two components showing the Sun at temperatures near 10 million degrees and - at the same time - around 400.000 degrees. This allows to see simultaneously very hot features such as flares and cusps, but also much "colder" features such as well-sized filaments and coronal loops. The compilation shows the activity near NOAA 3413 when this active region was already at the west limb, with a nearby filament ("prominence") in front (upper left), the eruption of this filament (upper right), the associated cusp (lower left), and finally the M6 flare itself (lower right). The clip shows the true dynamics of all these features. There's also a clip showing AIA 171 images providing a much better view on the coronal loops and the magnetic restructuring. There are some astonishing features and reconnection processes going on there!

