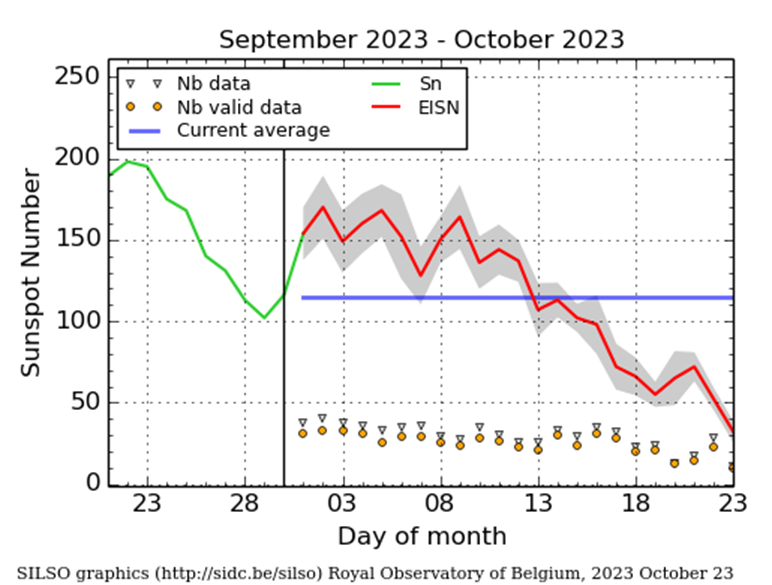
The estimated daily sunspot number (ROB/SILSO) continued to sharply decline this week. From values near 160 around 9 October, the sunspot number has dropped to values well below 50 by 23 October, barely 2 weeks later. Such low sunspot activity has not been recorded since early April this year and early December last year. The graph underneath shows the evolution of the daily estimated international sunspot number (EISN) as recorded by the observers from the SILSO network over the last month. It extends the official Sunspot Number from the full processing of the preceding month (green line), a few days more than one solar rotation. The horizontal blue line shows the current monthly average. The yellow dots give the number of stations that provided valid data. Only valid data are used to calculate the EISN. The triangle gives the number of stations providing data. When a triangle and a yellow dot coincide, it means that all the observations are used to calculate the EISN of that day.
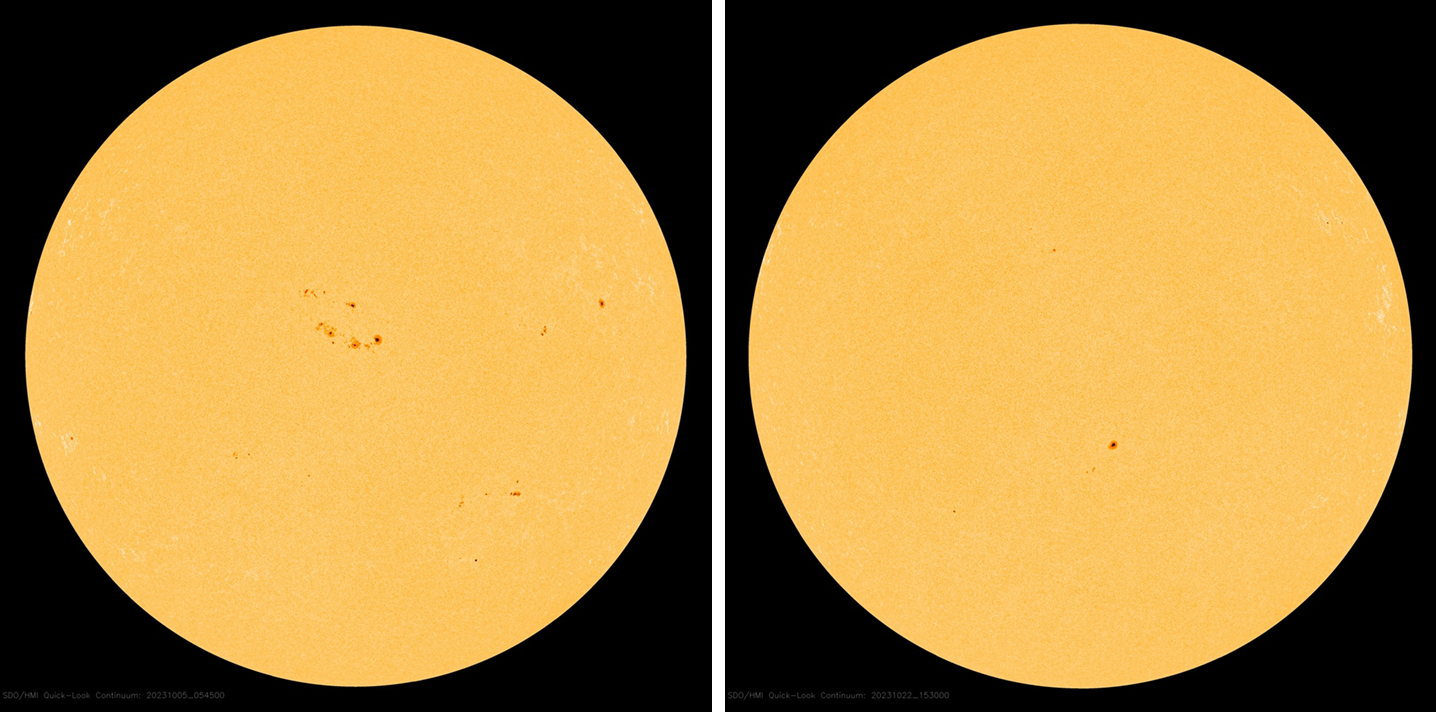
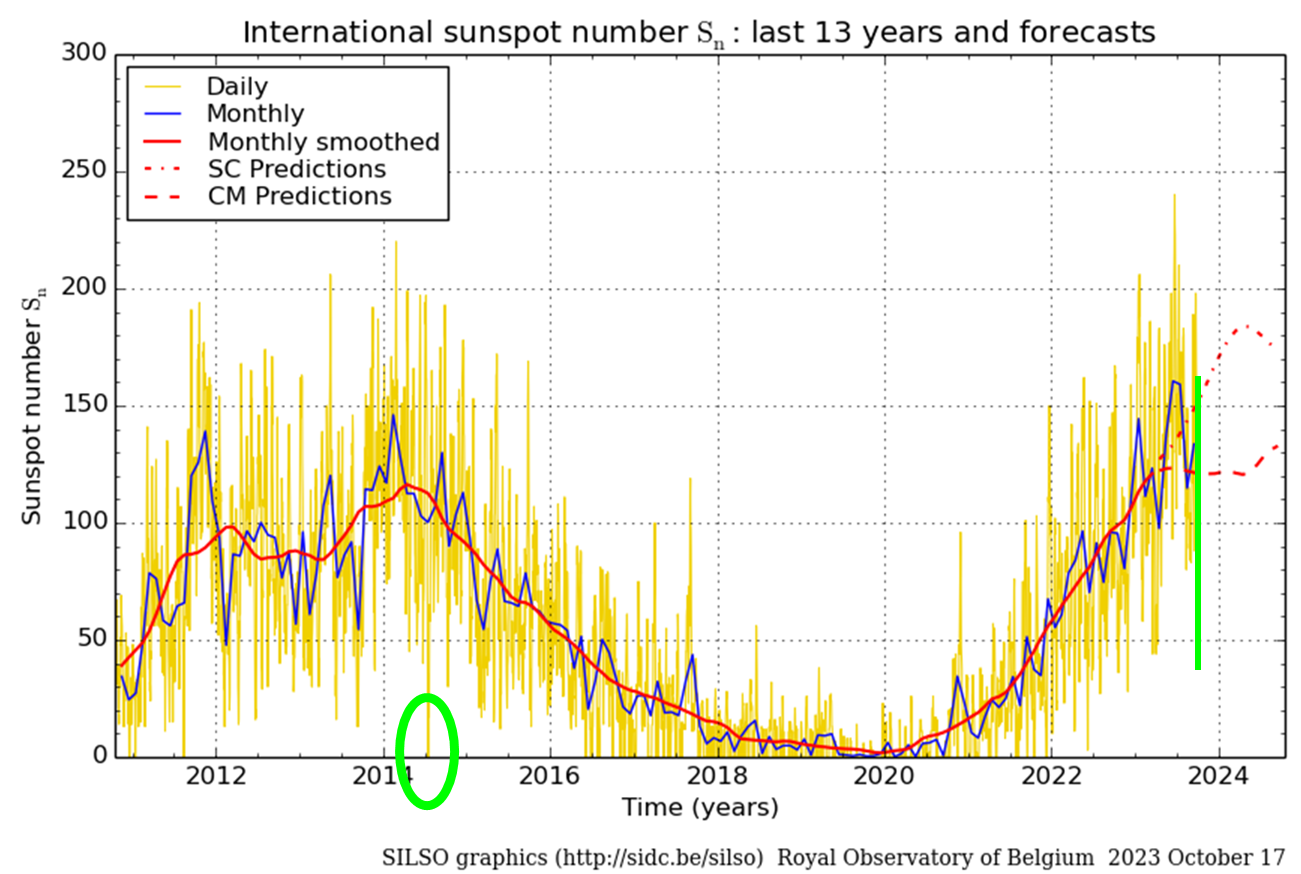
The images above were taken on 9 and 22 October by SDO/HMI and show the remarkable difference in appearance of the solar disk. The decline has also been noted in related parameters such as the sunspot area and the 10.7cm solar radio flux, both being at their lowest values since the start of the enhanced solar activity in December last year. So, have we passed the solar cycle maximum? Most likely not. The ups-and-downs in daily sunspot numbers are typical during the period of solar cycle maximum, such as e.g. during the previous solar cycle maximum when the daily sunspot number dropped from values close to 200 to 0 in barely 10 days (July 2014; see this STCE newsitem). Note the many sharp drops in the daily sunspot number during the entire maximum period of the previous solar cycle. It is one of the reasons why solar observers use monthly and smoothed monthly (see the SIDC formula) sunspot numbers, to weed out as much as possible this erratic behaviour of the solar activity and to get as such a better view on its overall evolution. The SILSO map underneath shows the daily, monthly and monthly smoothed sunspot number for the previous and ongoing solar cycle. It has been annotated (in green) to highlight the spotless day in July 2014, and contains a sketch of the low sunspot numbers over the last 2 weeks. We're not done with this solar cycle yet!