
The STCE's SC25 Tracking page has been updated to reflect the latest evolution of some critical space weather parameters for the ongoing solar cycle 25 (SC25). It covers various aspects of space weather, from sunspot numbers over geomagnetic indices all the way to cosmic rays. The multiple graphs allow for a comparison with previous solar cycles at similar stages in their evolution.
The graph below shows the monthly and SILSO smoothed monthly sunspot number (SIDC/SILSO smoothing formula) for the current and previous 2 solar cycles, SC23 and SC24. The prediction for the ongoing solar cycle 25 which started in December 2019, is displayed in green. The amplitude (115 +/-10) is based on the results from the international SC25 Prediction Panel, but in the graph the timing has been advanced to August 2024 following an update by the SC25 panel.
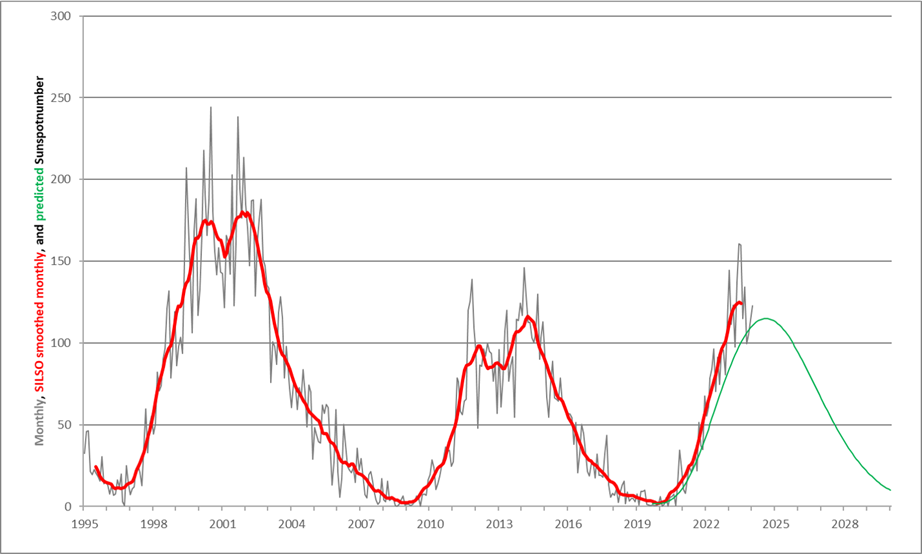
From March till November 2022, the monthly sunspot numbers were relatively stable between 75 and 95. Sunspot numbers then significantly increased from December 2022 onwards, with maximum monthly values reached in June (160.5) and July (160.0) 2023. The provisional smoothed monthly sunspot number has reached a first maximum of 125.2 in June 2023, which is already higher than the smoothed monthly maximum of the previous solar cycle SC24 (116.4). However, similar to SC24, it is expected that also SC25 will have a second maximum, thought to occur later in 2024, and also to be somewhat higher. The Solar Cycle Science website has a best-fitting (single maximum) curve indicating a maximum of 135.4 for SC25 in September-October 2024, which is slightly up from 129 one year ago. The SILSO predictions for SC25 maximum (12-month window) are also gradually converging to a maximum between 130 and 140 in the second half of 2024, remaining well above the initial prediction by the SC25 Panel (115).
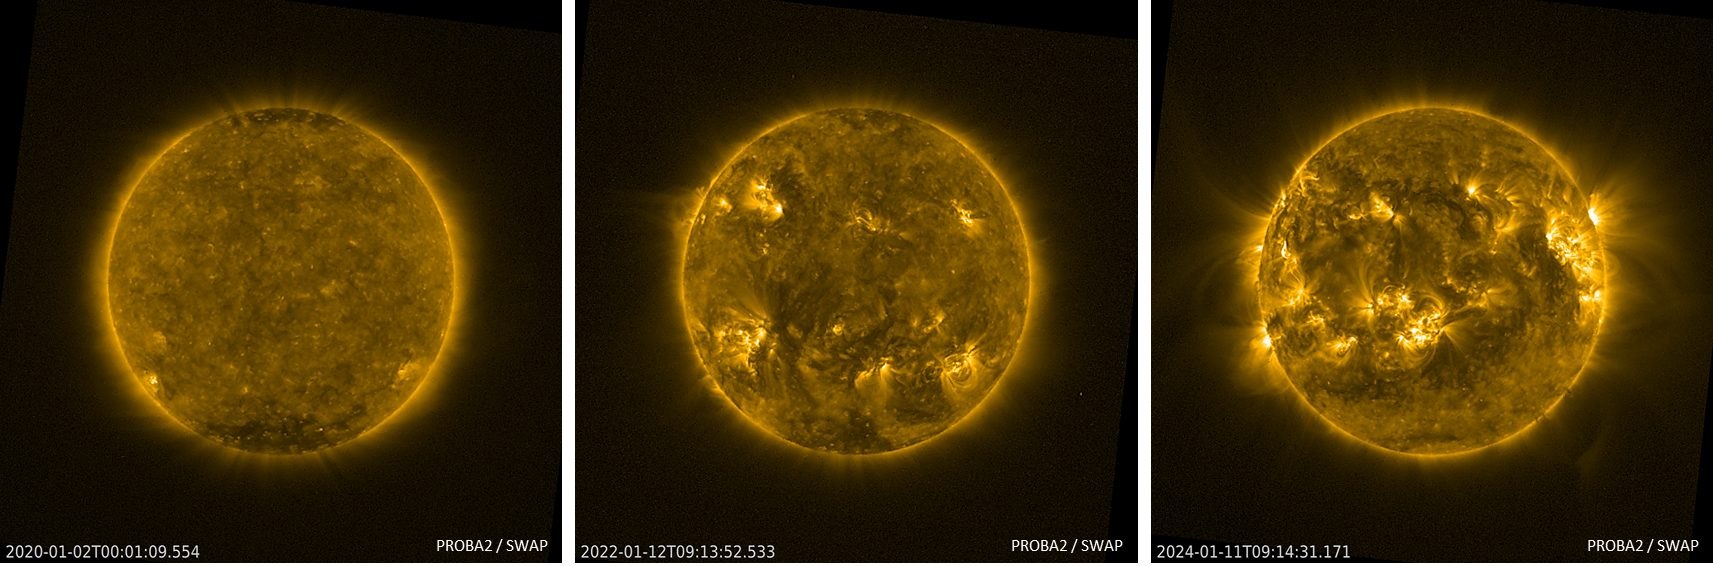
Some other space weather parameters also showed a maximum around mid-2023, such as the solar radio flux, the number of CMEs per day, and the geomagnetic Ap index (see STCE's SWx Classification page). The PROBA2/SWAP images above show the evolution of solar activity in extreme ultraviolet from the onset of SC25 in January 2020 until present, i.e. from solar cycle minimum until the ongoing maximum. The clip has one solar image per solar rotation (27 days). The increase in the number of active regions (bright areas on disk), the appearance of tall coronal structures (solar limb), and the gradual disappearance of the polar coronal holes are obvious. In the clip, the Sun seems to vary in size, due to the changing Sun-Earth distance throughout the year.
