
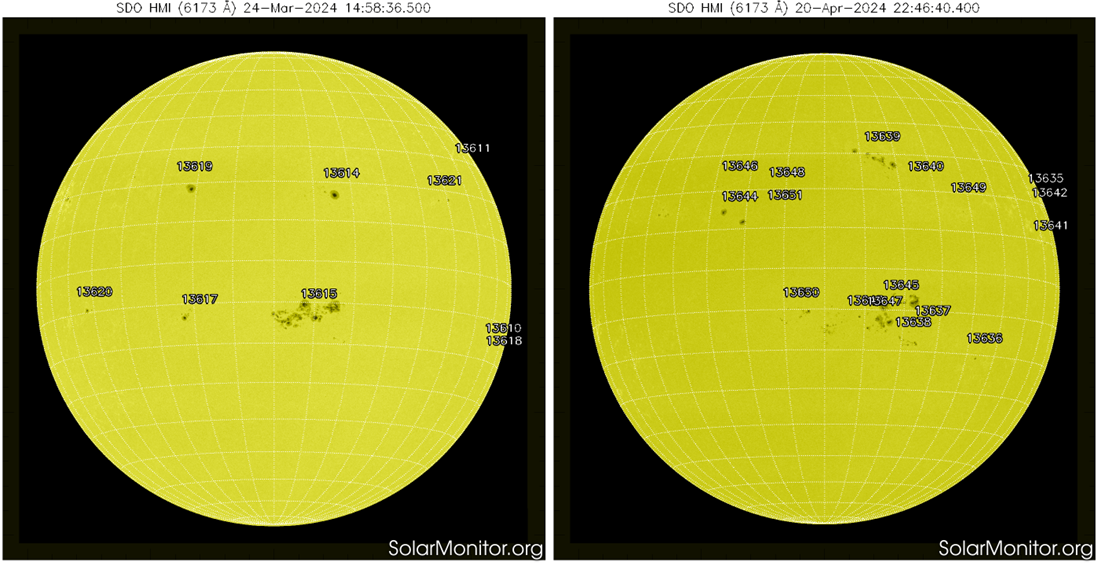
Sunspot activity rose to around 250 by 19 April, nearly doubling in just a week and more than 4 times higher than at the beginning of the month. Aside numerous small to medium sized sunspot groups, there was a huge sunspot complex in the southern solar hemisphere consisting of at least 5 sunspot groups. None of these groups contained large sunspots, but they were composed of many small spots. From 17 April onwards, most of the M-class flaring originated from the central portion of this complex (active regions NOAA 3643/3645/3647). This is also the location where complex sunspot group NOAA 3615 developed during the previous solar rotation (comparison ; STCE newsitem). The SDO/HMI clips underneath show white light imagery of the Sun and of the sunspot complex in the southern hemisphere from 17 to 21 April.
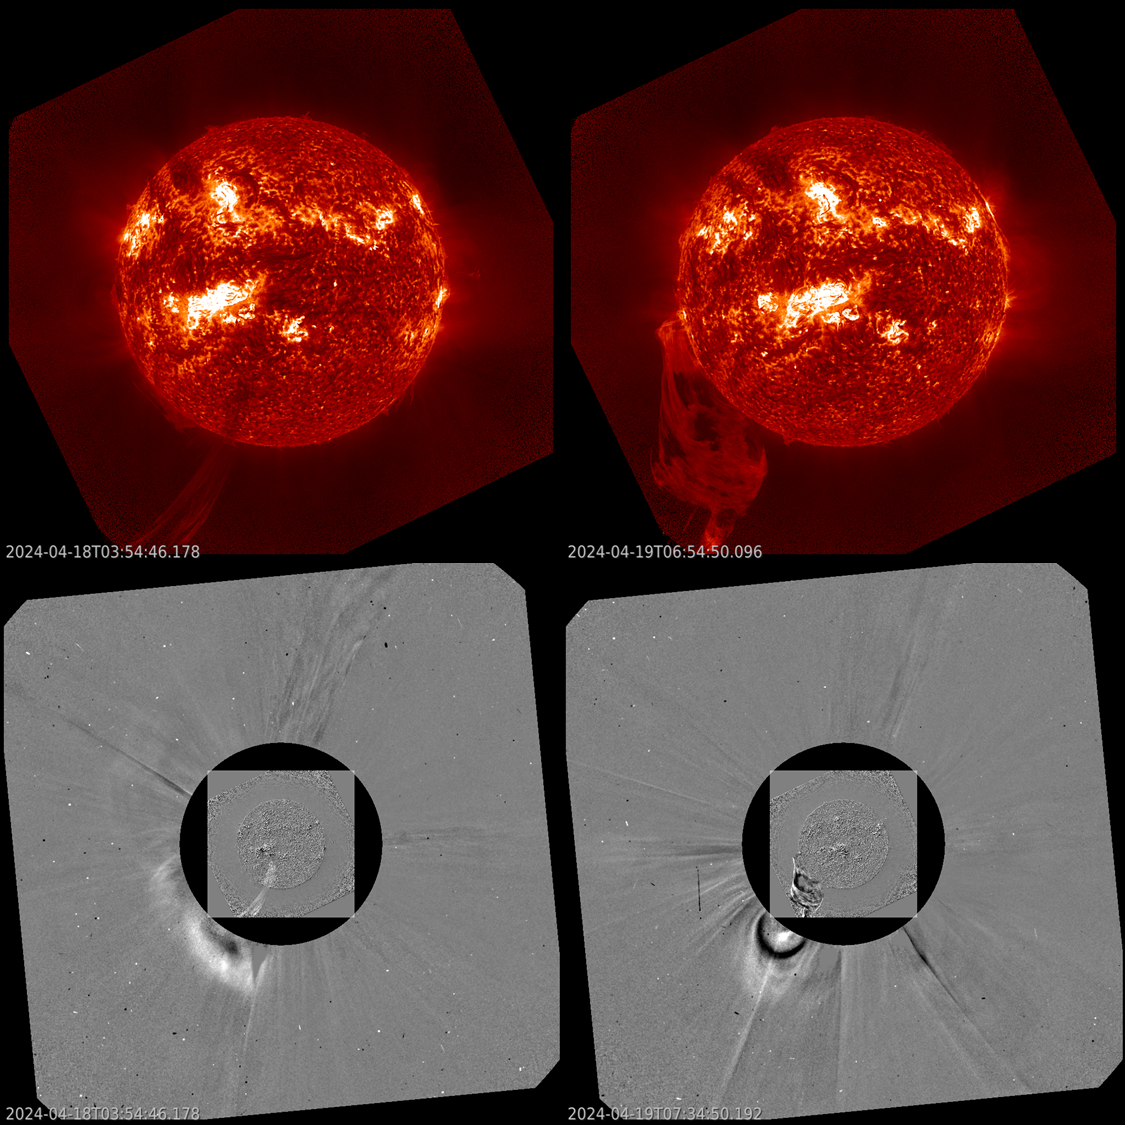
The most notable eruptive activity came from active region NOAA 3638, a rather small and deceivingly simple member of this sunspot complex located to the southwest ("lower right"). It produced numerous jetlike eruptions which were associated with relatively narrow coronal mass ejections (CMEs). These CME puffs were mostly directed south of the ecliptic (the plane created by the Earth in its yearly orbit around the Sun), though some of the wider CMEs may have an earth-directed component. The imagery underneath shows extreme ultraviolet images from GOES/SUVI (top row) and combined with coronagraphic imagery by SOHO/LASCO C2 (bottom row). Difference imagery, i.e. one image subtracted from the next, were used for the latter. The left column shows a jet with its associated CME early on 18 April, the right column shows an impressive prominence eruption (unrelated to the activity in the sunspot complex) early on 19 April.

 |
 |
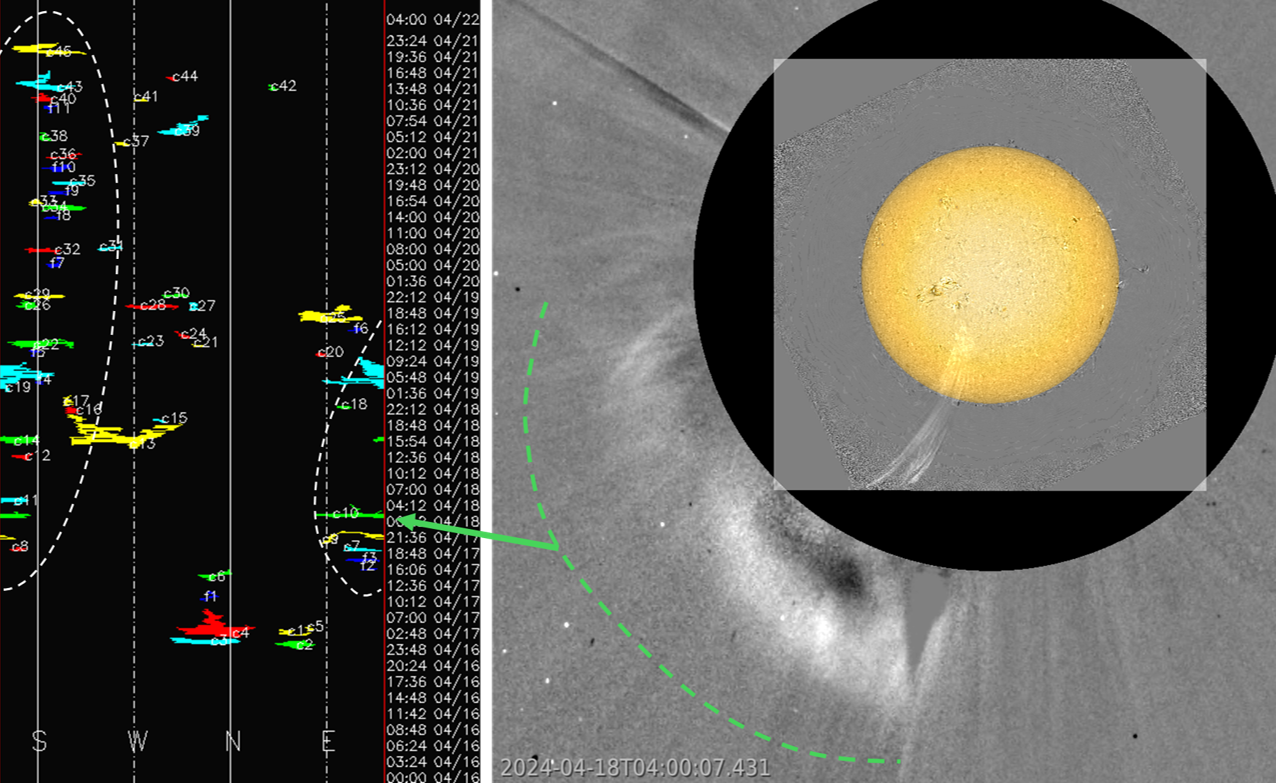
As the sunspot complex rotated from the south-eastern quadrant over the central meridian into the southwestern quadrant, NOAA 3638's puffs could also be traced in the CACTus diagram where a string of relatively narrow CMEs could be followed from east over south to west from 18 to 21 April, as annotated in the diagram underneath (white dashed line). In this diagram, the entire solar limb is stretched over a horizontal line with the principal directions (South West North East) indicated, and time moving upward. CMEs are then the short, horizontal, colored strings as observed moving in a direction. To the right of this diagram is a compilation tracing a jet from its source (NOAA 3638 - white light overlay) to its associated CME annotated with the green dashed line. The green color corresponds to the green color of the related CME early on 18 April on the CACTus diagram. Not all of the CMEs in the annotated portion of this diagram are related to CMEs from NOAA 3638, there are also some farside CMEs, and from 21 April onwards, some of the CMEs were associated with jetlike eruptions in NOAA 3636, 20 degrees to the west ("right") of NOAA 3638.
