
The ionosphere is located in the upper part of the Earth's atmosphere, between roughly 60 and 1000 km above the Earth's surface (see also this STCE newsitem). It is a partially ionized layer consisting of neutral atoms, molecules and charged particles. The latter are created by the ionizing effect of the extreme ultraviolet (EUV) and x-ray solar radiation on the atoms and molecules thus creating a layer of ions and electrons. At the altitude where the highest electron density occurs (a million electrons/cm3 at 250-450 km), only about one in every 1000 particles is ionized. This can be seen in the graph underneath, with the density of neutrals and ions indicated by respectively the green and other-coloured lines (Akbari 2015; Kelley 1989 - eBook ISBN: 9780323148054 ; Johnson 1969). The electron density is shown by the thick black line, and coincides with the evolution of the density of ionized oxygen (O+ ; orange line). Yet this relatively small number of electrons in the ionosphere is sufficient to affect radio communication as well as satellite signals used for communication and navigation. Solar flares (on the Earth's dayside), proton events (affecting the Earth's poles), and geomagnetic storms induced by passing coronal mass ejections (CMEs) can further affect the radio propagation and navigation capabilities.

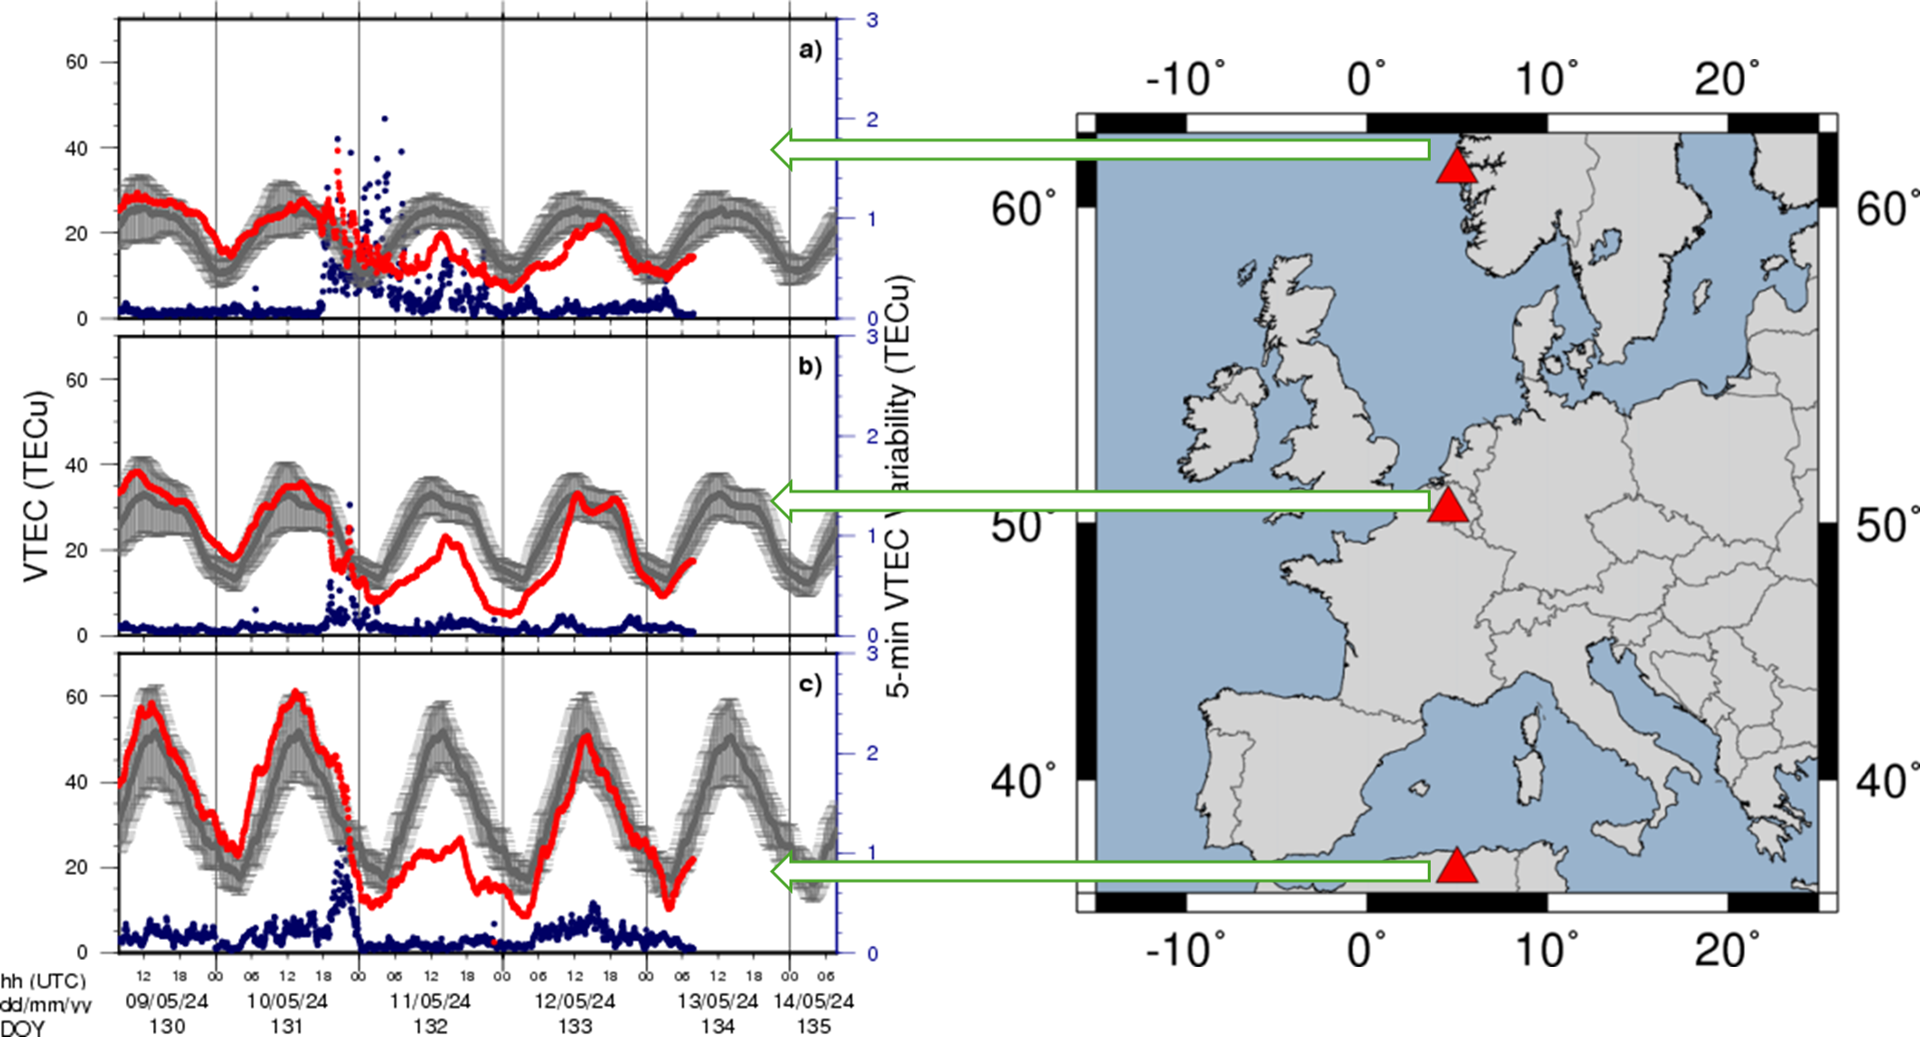
One of the parameters used to characterize the ionospheric conditions is the vertical total electron content (VTEC for short). TEC is the total number of free electrons integrated along the raypath between the GPS satellite and the receiver on the ground. It is estimated in a unit called TECU in which 1 TECU = 1016 electrons/m2. The VTEC is the vertical value of TEC projected from this raypath and thus independent of the elevation of the raypath. These electrons perturb the propagation of the GNSS (Global Navigation Satellite System) signals by inducing a so-called ionospheric delay. The VTEC is directly related to the signal propagation delay due to the ionosphere (delay on GPS frequencies). These ionospheric conditions are closely monitored by the STCE at the Royal Observatory of Belgium (ROB). The time series below is a time series of the VTEC (in red), the expected VTEC based on observations of the last 15 days (in grey), and the 5-min VTEC variability (in blue) in the North, Middle (Brussels) and South of Europe. The near-real time VTEC over Europe showed abnormal variations during the night of 10 to 11 May 2024. This is due to the strong CME impact detected during the afternoon of 10 May. This event resulted in sudden increases/decreases of the VTEC and high variability from 18:00 UTC on 10 May until the end of 11 May, especially over Northern-Europe.
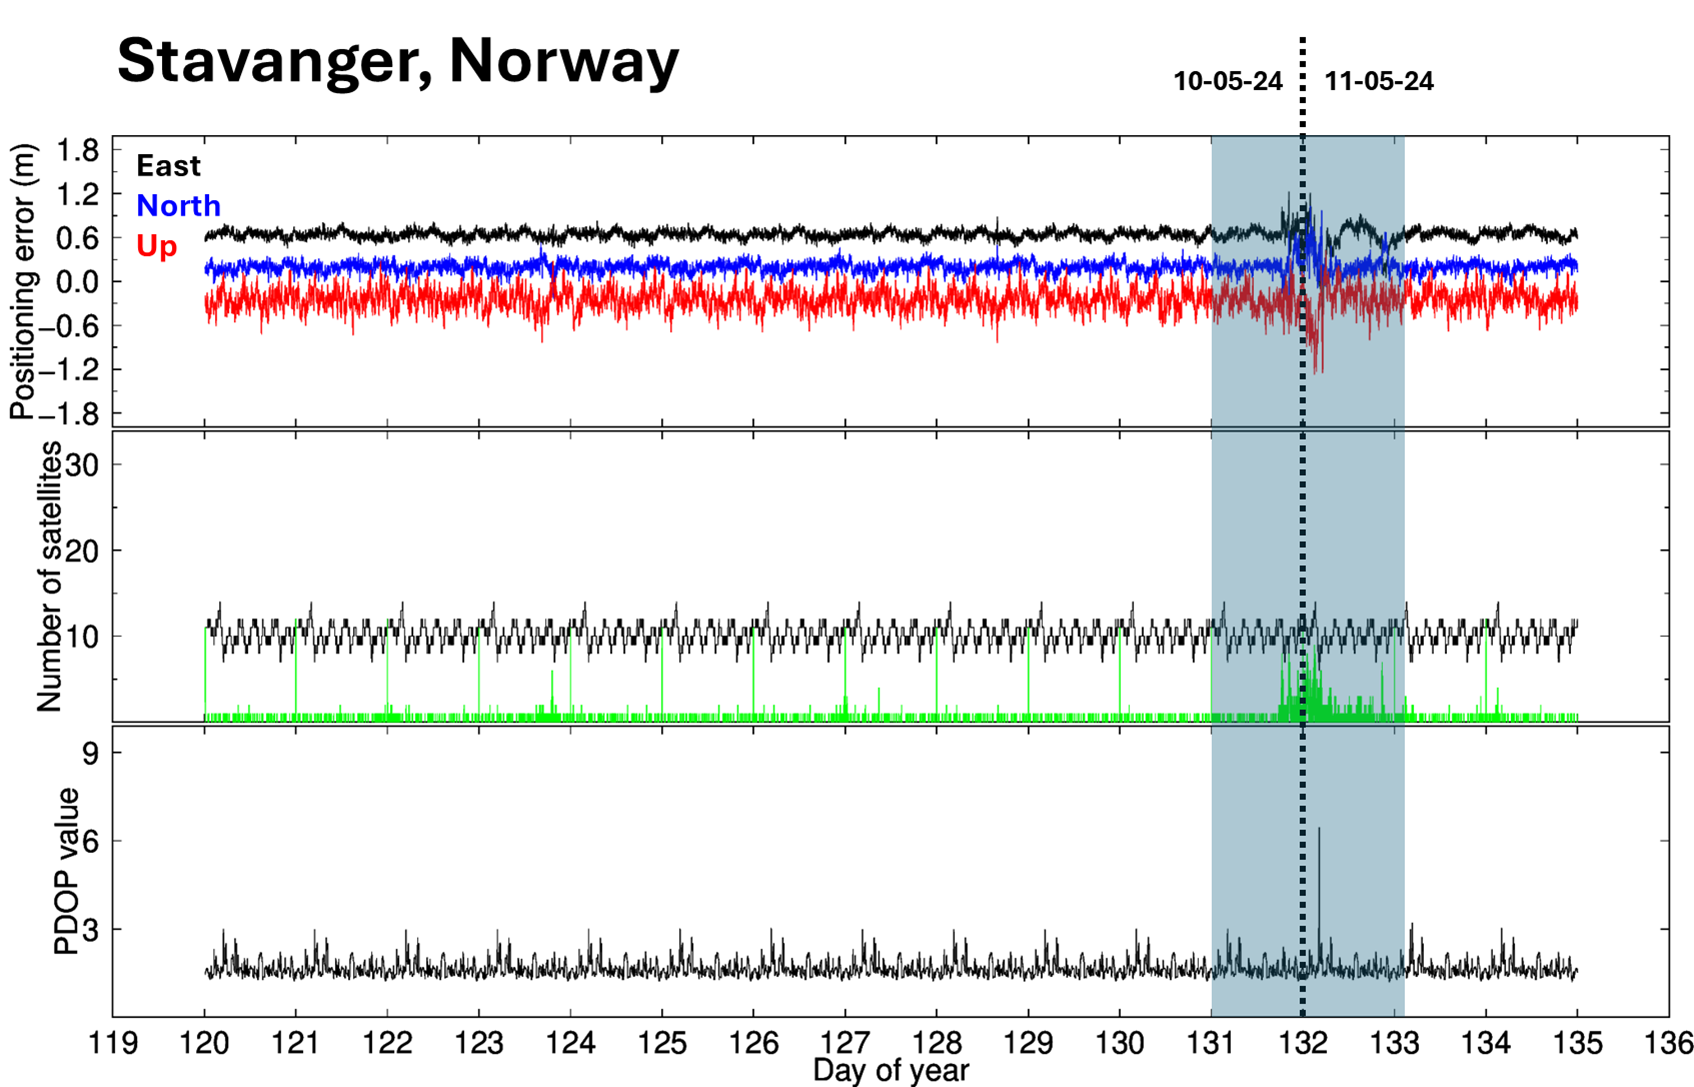
Additionally, the GPS single frequency kinematic positioning showed some abnormal errors, coinciding with these ionospheric disturbances (graphs underneath). While the position should be stable at cm level, the positions estimated during the event showed strong variations of several decimeters up to one meter. This can be explained by the loss of the signal from several satellites at the same time implying an increase of the PDOP (position dilution of precision), i.e. a decrease in positioning accuracy. The graph underneath shows 15-days GPS single frequency position variation for a station situated in Norway. Day of year 131 and 132 correspond to 10 and 11 May 2024 respectively, i.e. during the extreme geomagnetic storm. The top graph shows the kinematic positions in the three components. The middle graph indicates in black the number of satellites that are used for the estimation of the position, and in green the number of satellites for which the tracking signal was lost. The graph at the bottom shows PDOP (position dilution of precision) representing the error caused by the relative position of the GPS satellites. Further results are presently being analyzed to correlate the ionospheric activity and the GPS position degradation on a global basis.
The clip underneath shows the effect of the 10-11 May geomagnetic storm on the VTEC over most of Europe and at a 1 hour cadence (from the dedicated ROB website). The top left displays near real-time VTEC maps whereas the top right shows the expected VTEC maps. The most important map is then the one on the bottom left, which shows the differences between observed and expected VTEC maps. The bottom right is a histogram of the observed differences. Clearly, the geomagnetic storm had a strong impact on the ionosphere, with the electron density gradually evolving into a lower than usual value (blue colour). This meant that for High Frequency (HF) communication, the portion of higher HF frequencies was not available for HF communication, and so several advisories were sent to civil aviation via PECASUS to warn for this so-called "post-storm depression" (PSD).
This newsitem was written with the generous contribution of Nicolas Bergeot, Jean-Marie Chevalier and Jiang Guo (ROB/STCE - https://www.stce.be).
