The STCE's SC25 Tracking page has been updated to reflect the latest evolution of some critical space weather parameters for the ongoing solar cycle 25 (SC25). It covers various aspects of space weather, from sunspot numbers over geomagnetic indices all the way to cosmic rays. The multiple graphs allow for a comparison with previous solar cycles at similar stages in their evolution.
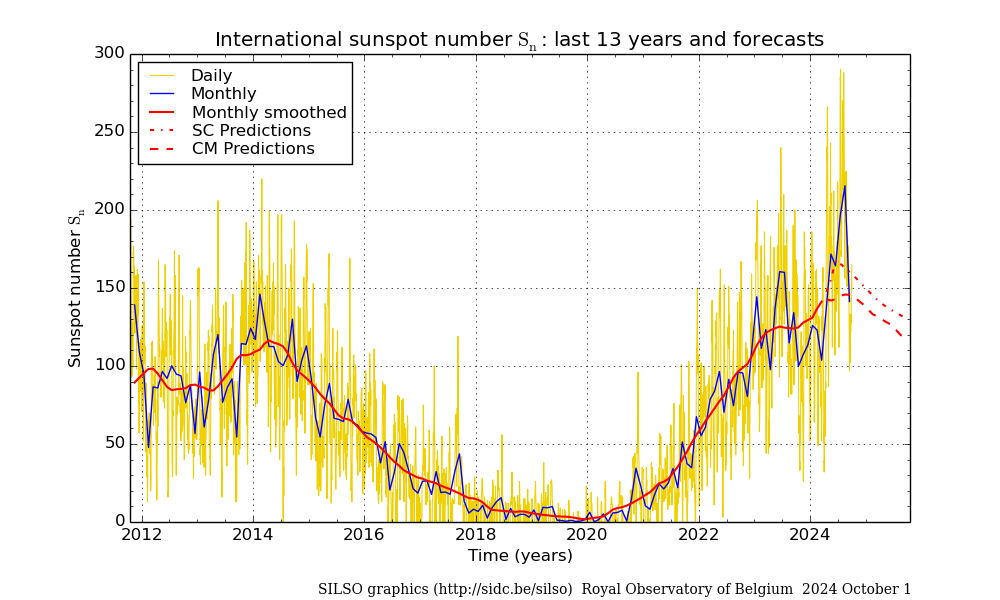
The smoothed monthly sunspot number reached a first maximum of 125.3 in June 2023, which exceeded already the maximum of the previous solar cycle SC24 (116.4). After a brief and mild decrease, the smoothed monthly sunspot number then increased again following high sunspot activity starting in April 2024 and continuing throughout the summer. Both in April, July and August 2024, there were several days when the provisional daily sunspot number exceeded 250. The provisional monthly sunspot number reached a maximum of 215.5 in August, which is the highest since September 2001 (238.2). This evolution indicates that SC25 is moving towards its second maximum, thought to occur later in 2024. The SILSO forecasts for SC25 maximum (12-month window) are converging to a maximum between 138 and 161 that would take place sometime between May and October 2024 (see this STCE/SILSO newsitem), remaining well above the initial prediction by the SC25 Panel (115). Of note is also that the Sun has reversed its polar fields in 2023 as announced by WSO: The south in mid 2023 and the north late 2023. This is a clear sign we are cruising now through solar cycle maximum (see this STCE newsitem).
Many other space weather related indices have reached high values during the last few months. Since the high solar activity started in April this year, the daily solar radio flux exceeded 200 sfu (non-flare driven!) on several days. The monthly radio flux value of 251.7 sfu recorded in August 2024 was the highest since August 1990 (252.1 sfu)! The enhanced solar activity has been accompanied by continuing high levels of solar EUV and x-ray emission. Consequently, the thermosphere has been getting hotter and expanded which may result in drag effects altering satellite orbits. The Thermosphere Climate Index (TCI) reached high values in September and October 2024, values that have not been observed since the maximum of SC23.
The number of solar flares followed suit, with SC25 now (up to 30 September 2024) having produced 1259 M- and X-class flares. About 11% of these events were produced in May 2024 (especially by NOAA 3664) and we have to go back to March 1991 to find a month with even more M/X flares (resp. 179 vs 143). March 1991 also has 2 X-class flares more than May 2024 (23 vs 21). Finally, May 2024 was the first month with more than 10 X-class flares in a single month since September 2005 with the famous active region NOAA 10808. The strongest solar flares so far during SC25 have been an X9.0 flare on 3 October 2024 by NOAA 3842 and an X8.7 flare by NOAA 3664 on 14 May this year. The strongest geomagnetic storms in SC25 occurred on 10-11 May (STCE newsitem) and on 10-11 October 2024 (STCE newsitem). We have to go back to the declining phase of SC23, i.e. 2003-2004, to find geomagnetic storms of similar intensity.
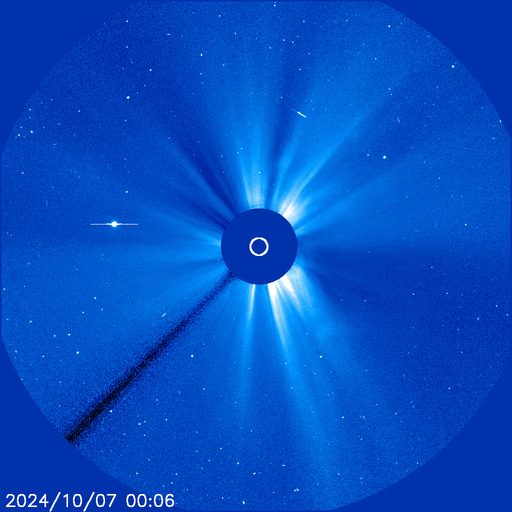
The clip underneath shows the coronal mass ejections (CMEs) as observed by the SOHO/LASCO C3 coronagraph from 7 till 15 October. It includes the halo CME early on 9 October that would cause the severe geomagnetic storm on 10 and 11 October, the associated proton event which was the strongest so far in SC25 (the "noise" in the images on 9 and 10 October), the planet Mercury (bright dot to the left), and the comet Tsuchinshan–ATLAS which passed through the coronagraph's field of view.