
Once again, a swarm of sunspots is rotating over the solar disk. This time, the sunspot hive started to rotated over the northern solar hemisphere from 28 January onwards, and so -at the time of this writing (3 February)- it is close to the Sun's central meridian. Dozens of sunspots of varying sizes are squeezed together in an area of about 12 by 20 degrees. Then, late on 1 February, additional, isolated sunspot groups started to develop to the northeast ("upper left") and southeast ("lower left") of this cluster, adding even more to the size of this already very complex area. The SDO/HMI clip underneath shows the entire sunspot cluster covering the period from 1 to early 3 February.

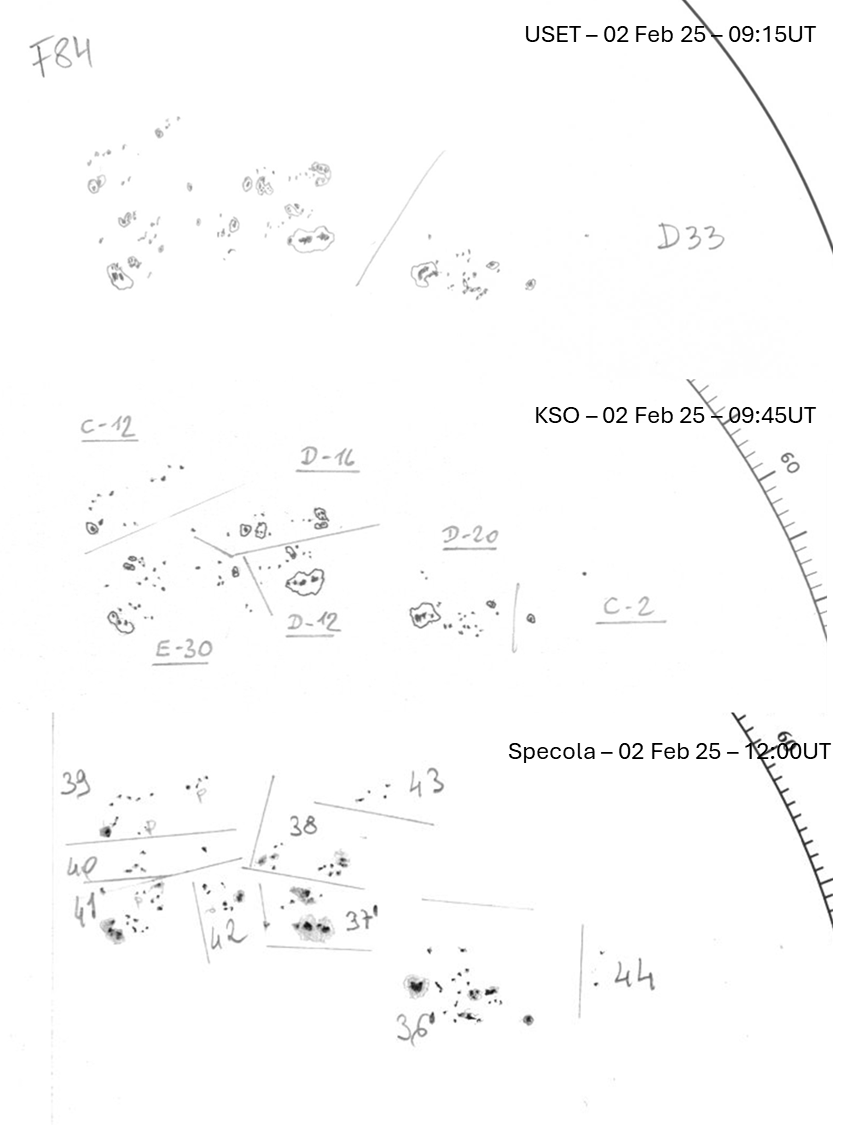
To the solar observers, this kind of sunspot clusters is also known as the "sunspots from hell" (that's a little joke...). Indeed, it is downright difficult to determine how many sunspot groups are actually present in such a cluster, as can be gauged from the solar drawings underneath. They were all made by reputable solar observatories such as USET (Royal Observatory of Belgium), The Kanzelhöhe Observatory for Solar and Environmental Research (KSO, Austria), and the Specola Observatory in Locarno (Specola Solare Ticinese, Switzerland). For 2 February, they count respectively 2, 6, and 9 sunspot groups, as shown in the drawing cuts underneath. Note the reversed image orientation compared to the SDO imagery, i.e. in the east-west direction, and that the Specola observation contains at least one group that was not visible yet a few hours earlier in the USET and KSO observations (Specola nr 43 ; NOAA 13982). The NOAA/USAF observers reported 5 active regions (https://www.solarmonitor.org/index.php).
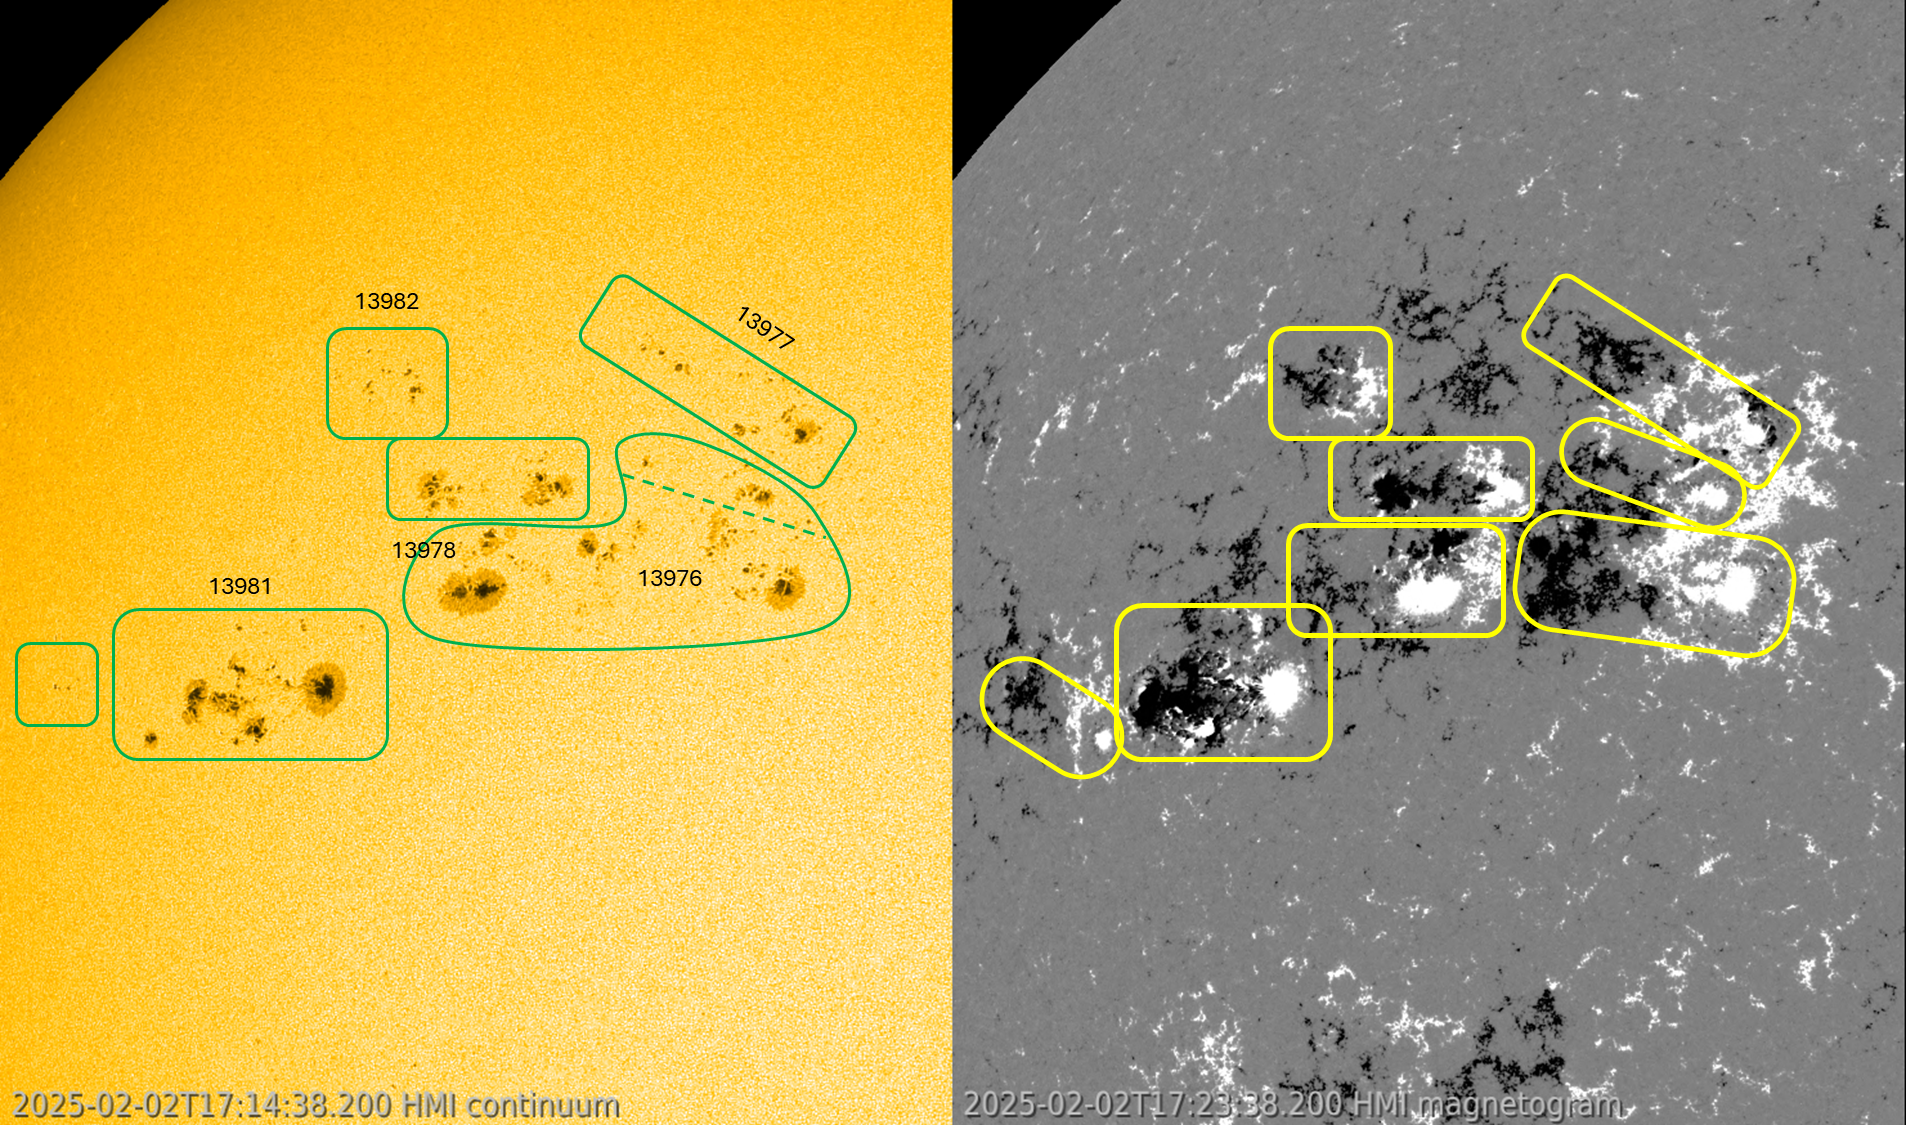
Claiming that there's a single, correct solution to this problem is a bit exaggerated, certainly in view of the rapidly evolving number, size and location of the various sunspots. For splitting up sunspot groups, one has to keep in mind that a solar observer -in order to keep consistency with the old observations when no magnetic imagery was available- is only allowed to use white light imagery. He can use "rules" such as e.g. that the leading spot usually is larger and more inclined to the solar equator than the trailing spot. Independent active regions evolve by themselves, without much interaction with their neighbours. Also, in case there's still doubt, sunspots and sunspot groups less than 5 degrees in latitude and/or 10 degrees in longitude are usually taken together. The annotated SDO/HMI white light image (underneath left) shows a possible solution of 6 sunspot regions (green boxes), with a debatable 7th group possible (above the dashed line). The numbers in black are the active regions as reported by NOAA. On the right is the corresponding SDO/HMI magnetogram. Here, the simplest way forward is to look for bipolar regions, with in this case "white" being the magnetic polarity of the leading region (magnetic field lines coming out of the solar surface), and "black" being the magnetic polarity of the trailing region. Here, 8 regions can be quite easily identified (yellow boxes).
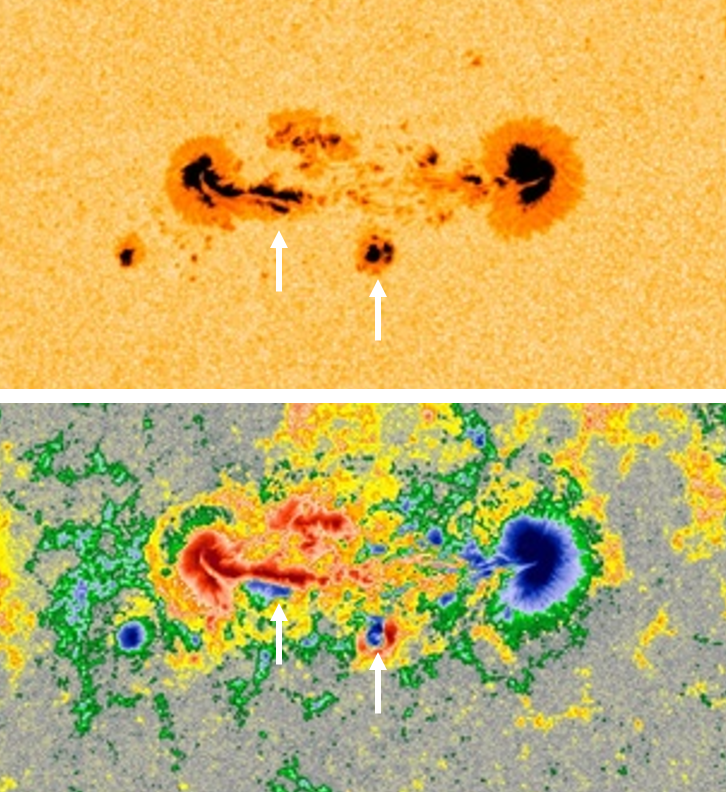
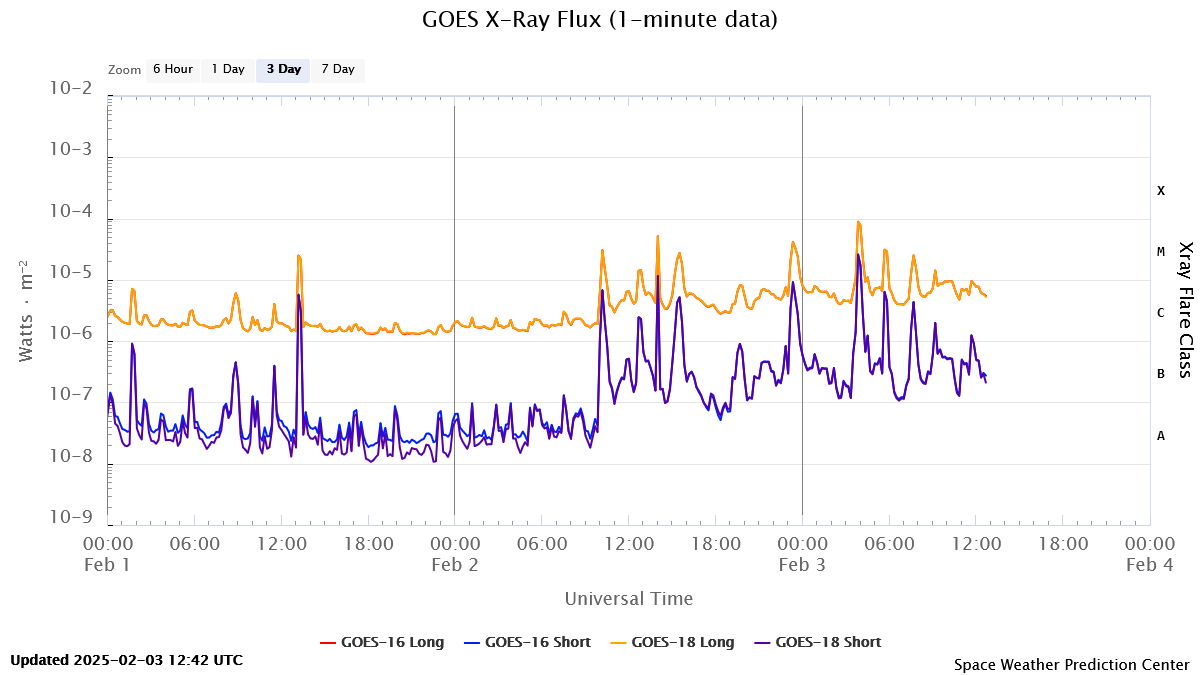
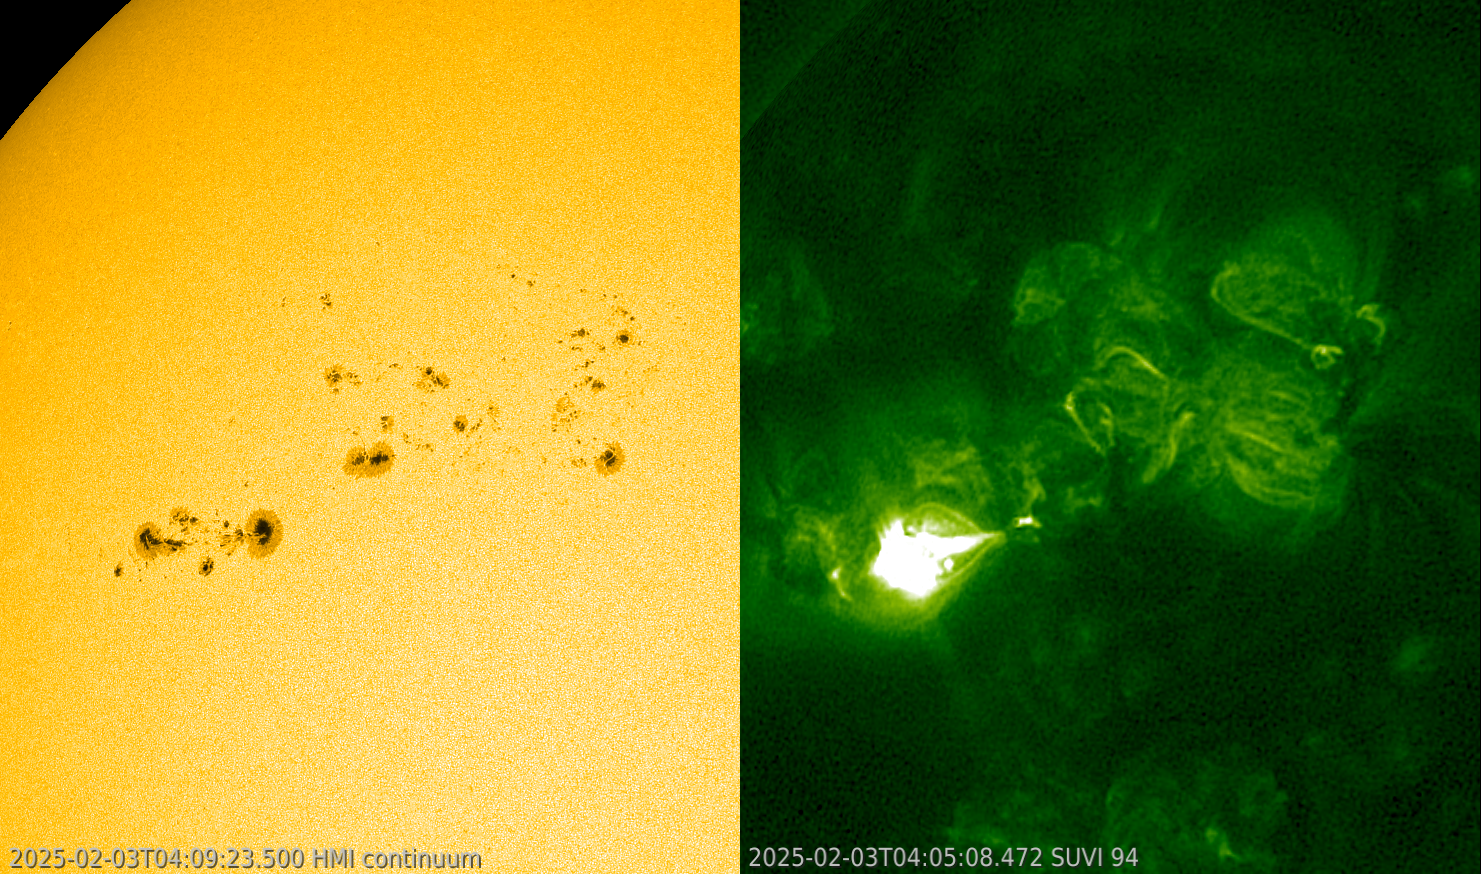
Correctly separating the sunspot groups (as much as possible) is important, as it is the first step in the classification of the groups: usually according to the McIntosh scheme in white light, and according to the Mount Wilson scheme when using a magnetogram (see the STCE SWx classification page). At least here, there's one certainty: if there's a magnetic delta structure present in an active region, then the chance on (strong) flares is significantly higher than if there's no delta present. A sunspot group is said to contain a delta structure when it has at least one mature spot that contains umbrae of opposite magnetic polarities separated by less than 2 degrees and situated within the common penumbra. The imagery underneath shows a white light image and a magnetogram of NOAA 13981 early on 3 February. The region clearly contains 2 delta structures, as indicated by the white arrows. From 2 February onwards, it was the source of several M-class flares, the strongest being an M8.8 flare peaking on 3 February at 03:58UTC. A combo of a SDO/HMI white light image and a GOES/SUVI extreme ultraviolet image can be found underneath (the clip covers 2-3 February). Notice also how some of the spots are stretched, another sign of the powerful magnetic field strengths that are present there. It's obvious that an X-class flare is possible from this region as long as the magnetic delta structures persist.

