
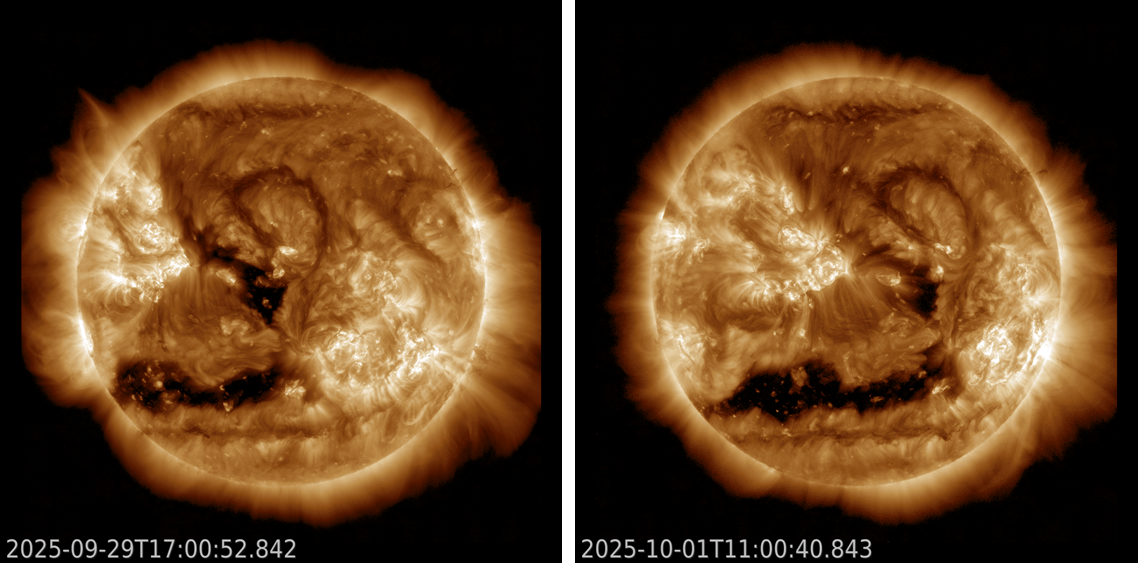
Coronal holes (CHs) are regions in the hot solar atmosphere ("corona") where the plasma density at that temperature is very low compared to its surroundings, and thus they look like dark shapes when viewed in extreme ultraviolet (EUV). Linked to unipolar (i.e. "open") magnetic fields stretching into space, they are the source of the high-speed solar wind which can create geomagnetic disturbances. Space weather forecasters at the SIDC of the Royal Observatory of Belgium assign a number to each CH that appears on the Sun (link). The SDO EUV images underneath date from 29 September and 1 October, and show two such CHs as they transit the Sun's central meridian : SIDC CH 128 in the northern solar hemisphere, and the very elongated SIDC CH 123 in the southern hemisphere. They both had a positive magnetic polarity, meaning that the open magnetic field lines are pointing away from the Sun.
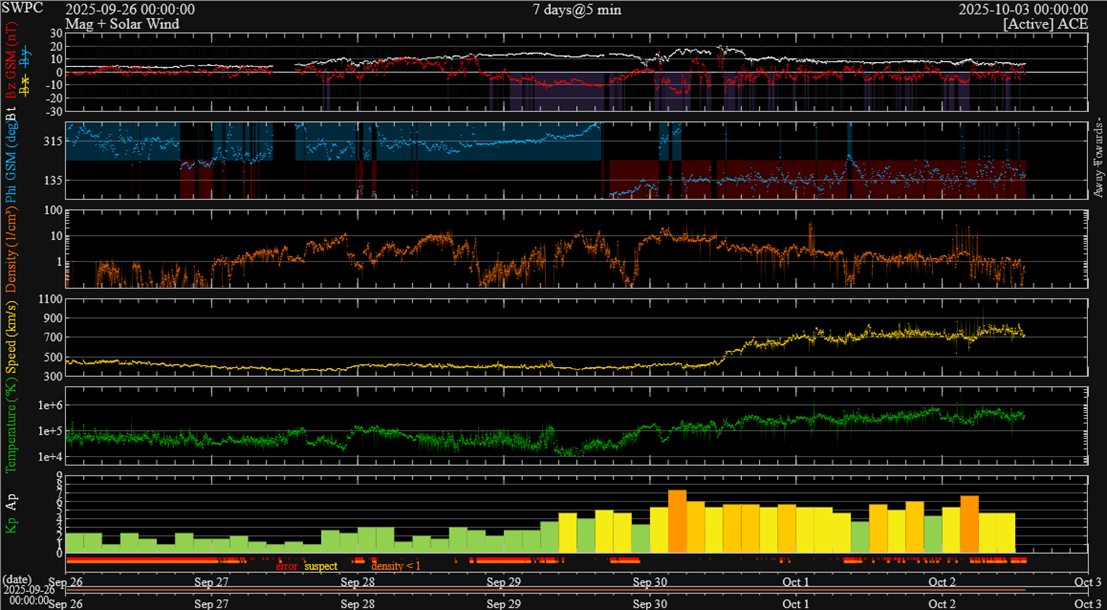
The related high-speed low-density solar wind stream arrived on 30 September, with wind speeds reaching values around 800 km/s (yellow curve in the DSCOVR chart underneath). The resulting geomagnetic storm reached strong levels (Kp = 7 ; lower panel). In Belgium, moderate storming levels were reached (K_BEL = 6).
Solar wind speed was steady above 500 km/s from 30 September until 5 October. This created favorable conditions to significantly increase the number of energetic electrons (energies greater than 2 MeV). These particles are known to have a detrimental effect on spacecraft operations. The alert threshold of 1000 pfu (particle flux units) was already reached by the end of 1 October (GOES). It would eventually reach 30.000 pfu during the subsequent days, as can be seen in the GOES chart underneath. Time (days) is on the horizontal axis, the electron flux -the number of highly energetic electrons (energies of 2 or more MeV) per cm2 per second and per steradian- is on the (logarithmic) vertical axis. The "M" and "N" indicates the local "Midnight" and "Noon" for the GOES-19 and GOES-18 satellites.
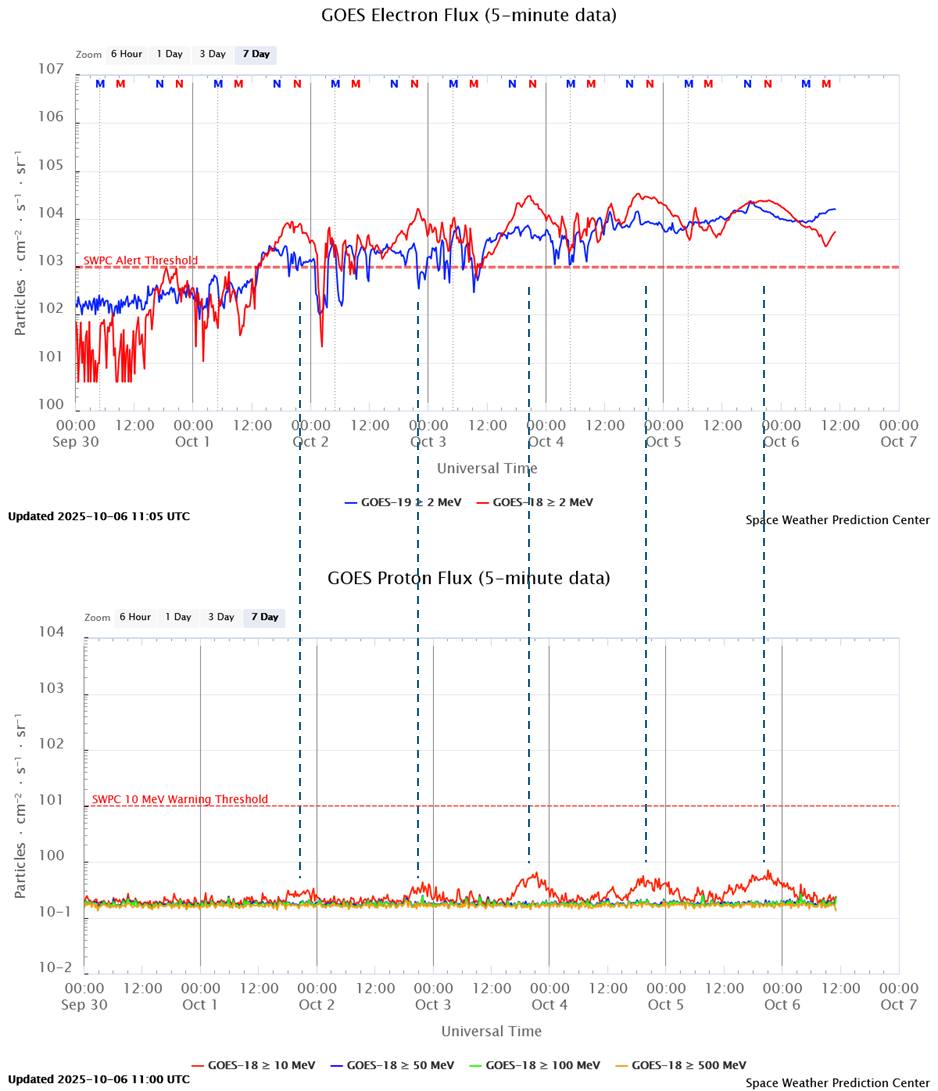
Interestingly, the proton flux as measured by GOES-18 (lower graph in the annotated figure above) also showed regular enhancements. Usually this would indicated some strong flare events on the Sun where such highly energetic particles are sometimes released. Not so this time. The regular timings of the daily proton flux enhancements give it all away. Indeed, they all peak around 20:00-21:00UTC, which corresponds to the current local noon for the GOES-18 satellite (illustrated by the vertical dashed lines connecting the electron flux and proton flux charts). This is the time when GOES-18 flies through the densest portion of the outer radiation belt. As it turns out, the proton flux measuring device on GOES-18, and in particular the channel that measures the proton flux in the energy band between 12 and 25 MeV (Kress et al. 2021) is sensitive to enhanced fluxes of very energetic electrons. As NOAA writes in their data user report from 2023 (link): "SGPS-X and +X P5 are contaminated with electrons when radiation belt fluxes are elevated. The magnitude of the contamination is very small with respect to solar proton fluxes during a moderate SEP event." SGPS means "Solar and Galactic Proton Sensor" and is the actual measuring device, +X and -X indicate the direction in which the sensors are looking (there are two), and P5 is the channel measuring the flux of protons with energies between 12 and 25 MeV. It is obvious that the effect is visible in the red curve of the proton chart (protons with energies greater than 10 MeV) only, and that the effect is indeed small compared to a typical proton event (remember: logarithmic scale!). In fact, it is not much of a nuisance if you know what is going on.
