NOAA 14566 (SIDC sunspot group 992) rotated onto the solar disk on 1 November as a small but wide bipolar sunspot group. Hardly a day later, a new active region started rapidly developing just behind (east of) the trailing portion of NOAA 14566, and by noon on 3 November, the leading portion had already bumped into the trailing main spot of NOAA 14566. As this new group grew in size and new magnetic flux emerged, several delta structures (two sunspots of opposite magnetic polarity very close together within the same penumbra) developed. This can be seen in the SDO/HMI images underneath with white light (top) and magnetograms (bottom). In the magnetograms, white denotes areas of positive magnetic polarity (magnetic field lines coming out of the Sun), black indicates areas of negative magnetic polarity (field lines returning to the Sun). The movies cover the period from 3 to 9 November at a cadence of 1 image per hour.


The complex magnetic structure of NOAA 14566 can also be seen in the overlay underneath, where an extreme ultraviolet image (SDO/AIA 171) is laid over a white light image (SDO/HMI). Both images were taken on 8 November at 13:00 UTC, and the combination shows the loops over NOAA 14566 as well as its connections with nearby smaller and or decaying groups such as NOAA 14569 to the west and NOAA 14568 to the east. "Bumper car" regions are well known for their ability to produce strong flares. One of the best examples is the 9 August 2011 event when -in an almost identical scenario- a strong flare was produced reaching a maximum intensity of nearly X10 (X6.9 in the old, uncorrected GOES scales). Eventually, it would turn out to be one of the strongest flares of the entire solar cycle 24. Movies and descriptions of this event can be found in the STCE's "Best of... 2011" space weather highlights overview.

It's no surprize then that space weather forecasters kept their eyes on rapidly evolving NOAA 14566. Its complex magnetic structure and the presence of the delta structures quickly increased the flare production of this active region. Yet, despite the size of the main spot, the flare activity remained mostly at C-class level, with only a handful of low-level M-class flares recorded. On 7 and on 8 November, the number of produced C-class flares was respectively 26 and 28 (from the daily NOAA event reports), and almost exclusively produced by NOAA 14566. These values belong to some of the highest observed (per day!) so far this solar cycle. The left portion of the table underneath shows the days ranked according to the highest number of C-class flares, limited to days with 25 or more C-class events and for the current solar cycle (SC25) only. Note that double flares for the same event ("a flare with a double peak") are counted as one flare only.

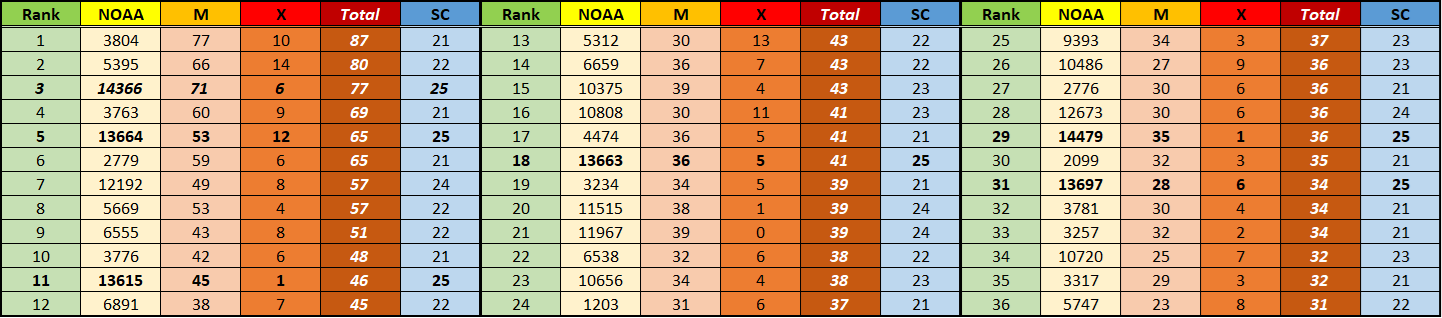
In the right portion of the table, days are ranked according to the highest number of M- and X-class flares (summed). It only mentions those days with 14 or more M- and X-class flares, with the top day reaching 23 flare events on 29 December 2024 - that's basically 1 M- or X-class flare every hour!... Usually, for such high flare numbers, multiple flare-active sunspot groups are required ("Various" in the table). Occasionally, one active region is up to the task, such as NOAA 14366 early February this year. On 1 and 2 February 2026, it produced resp. 19 and 17 moderate and "extreme" flares, eventually becoming one of the most flare productive groups this solar cycle (see the table at the STCE SC25 tracking page). Note also the on-the-average 30% difference in the 10.7 cm solar radio flux between the left (about 150 sfu) and right (about 200 sfu) portion of the table. The radio flux is a parameter used in atmospheric drag calculations for satellite orbits, and expressed in solar flux units (sfu). Note also the lack of C-class flares in the right-hand portion of the table. Indeed, when the Sun is so actively flaring, it drives the background soft-x rays (SXR) flux to levels approaching M-class level, thus obscuring any C-class flares that are happening. This can be seen in the comparison underneath, with the upper graph showing the SXR flux evolution early February 2026 and the lower graph showing the SXR flux evolution early November 2026.