The last 3 months of 2020 saw a significant increase in sunspot activity, with the international sunspot number (ISN) reaching nearly 100 on 29 November (See this STCE Newsitem). As the new solar cycle 25 (SC25) is barely 1 year old, this raised the question how unusual this increase was.
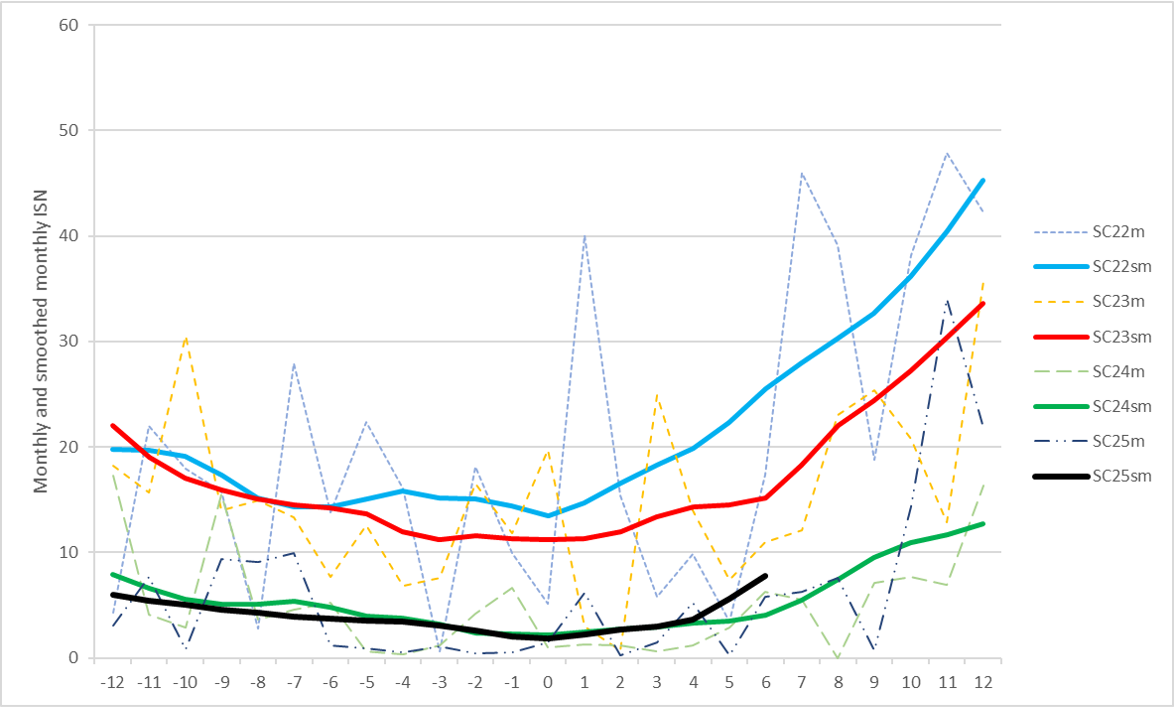
The figure underneath compares the monthly (m) and smoothed monthly (sm) sunspot numbers of solar cycles 22 to 25 from 1 year before to 1 year after the month of the smoothed sunspot minimum (month "0"). The smoothing is done using the SILSO smoothing formula. The evolution of the smoothed ISN clearly shows how deep the minimum was of the ongoing and previous solar cycle compared to SC22 and SC23. It is also obvious that, 1 year after the minimum, the increase of SC24 was significantly slower than that of SC22 and SC23. With still 6 months to go, the current smoothed sunspot numbers of SC25 seem to be slightly above those of the previous solar cycle, but the further evolution will depend on the solar activity in the coming months. Indeed, at this stage of the solar cycle, the monthly sunspot activity remains one with ups and downs - as can be gauged from the chart underneath.

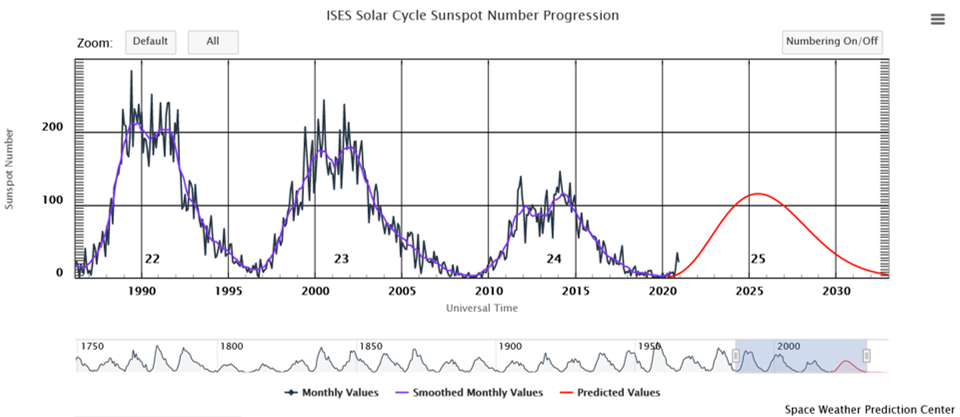
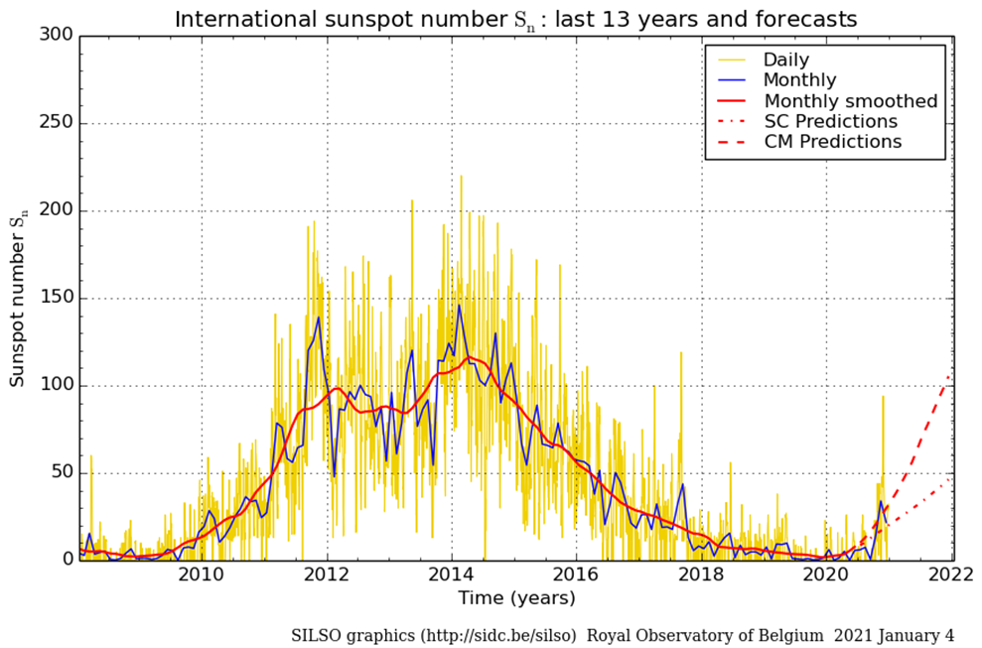
The international SC25 prediction panel expects a maximum smoothed monthly ISN for SC25 of 115 +/-10 (see this Newsitem). The evolution of SC25 can be followed on dedicated solar cycle webpages at NOAA/SWPC and at SILSO - see the charts underneath. By the summer of 2022, the factual observed sunspot numbers will give a better estimate of the SC25 maximum that can be expected.


