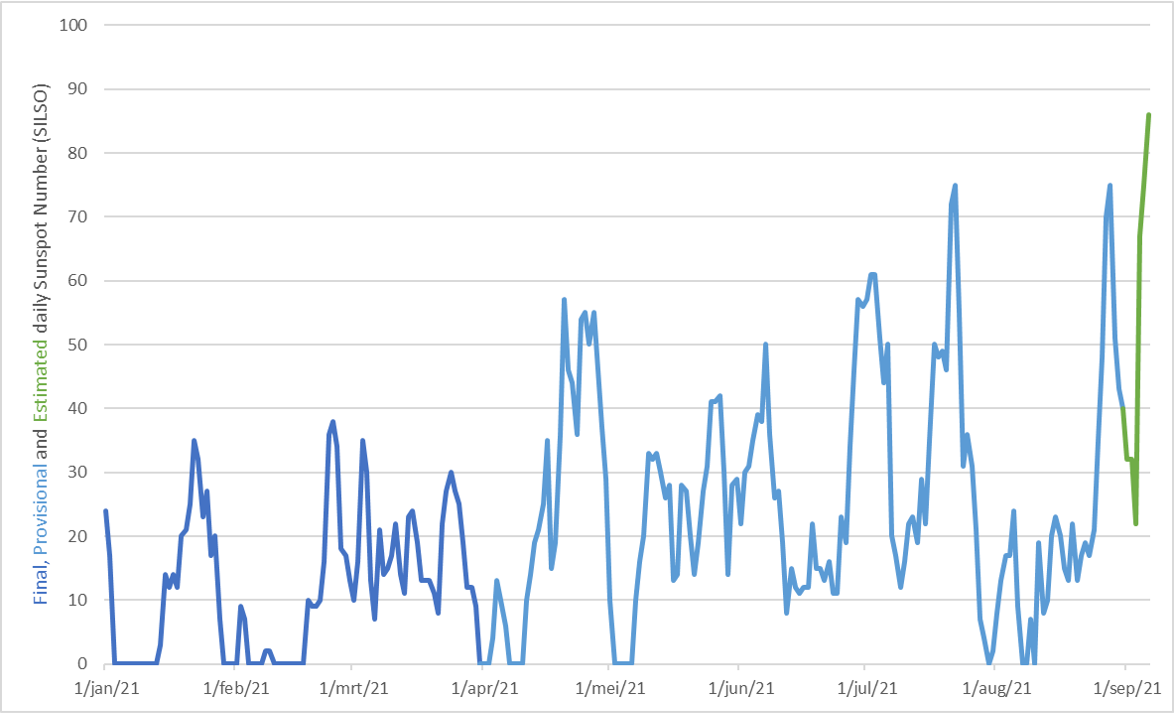
After a few days of low sunspot numbers, late last week (from 5 September onwards) saw suddenly a flurry of relatively well-sized sunspot groups. These concerned not the ususal sunspot groups consisting only of small featureless sunspots such as McIntosh A- and B-types (see the STCE's SWx Classification page), but regions with a fair amount of individual sunspots (D-type with mature main sunspots). Thus, the estimated sunspot numbers rose again to values of 70 and higher, and may possibly be the highest of the year so far. The graph underneath shows the daily sunspot numbers from 1 January till 6 September, as taken from the SILSO website. The provisional daily sunspot numbers do usually not differ very much from the final ones, hence the almost identical colour. The estimated numbers (in green) concern the first 6 days of September, are often based on a smaller number of observations than the final ones, and so may differ a bit more from the final daily sunspot numbers. Nonetheless, one can see that the recent September sunspot numbers are at least similar to other peaks in the daily sunspot numbers seen earlier this year, and may potentially be even the highest so far in 2021. Despite their size, the active regions remained fairly flare inactive.

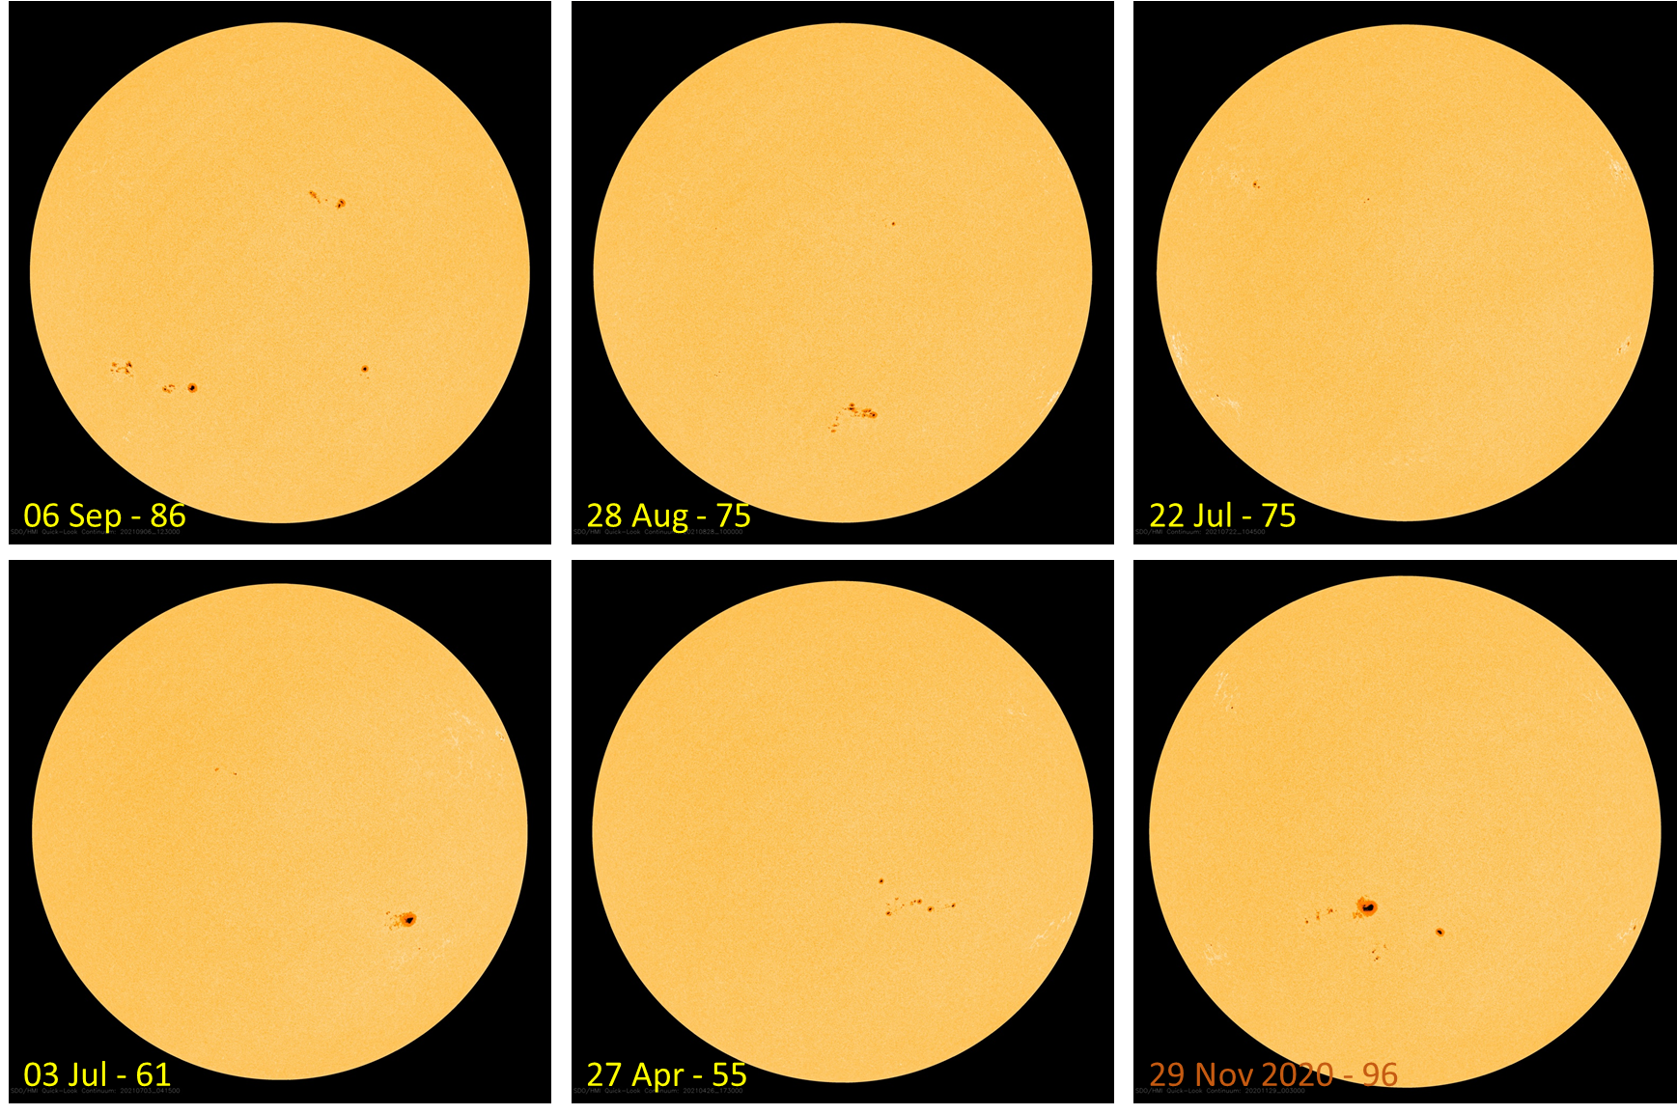
The interesting enhancement of sunspot activity can also be seen when comparing solar white light imagery. On 5 and 6 September, there were 4 well-sized groups, with mature main spots and many small spots in the intermediate portions. The difference with previous peak days of enhanced sunspot activity can be seen in the SDO/HMI images underneath, where mostly it concerns 1 big group with a few small groups (barely visible), or several (5-6) small sunspot regions. For comparison, the image to the lower right was taken on 29 November last year, which is -currently- the day with the highest sunspot number so far this solar cycle. All images have the date and sunspot number on the lower left.


