
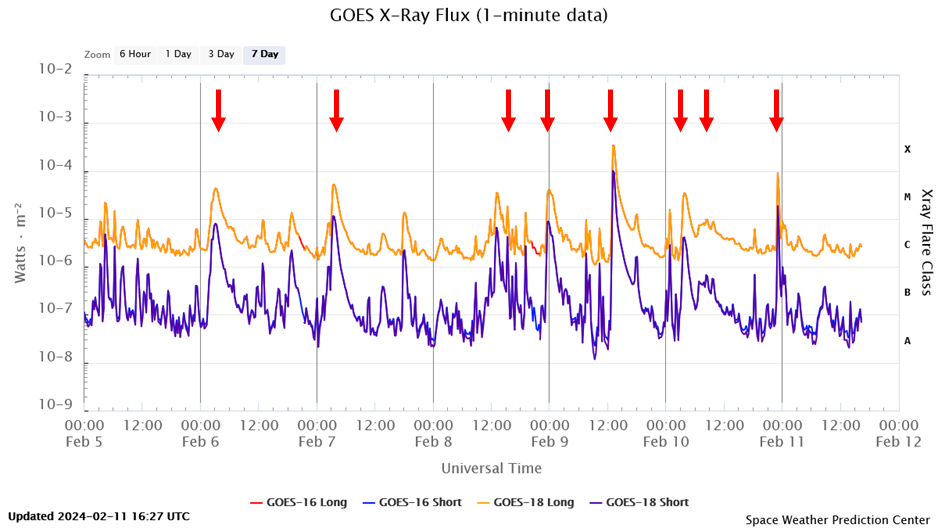
According to the NOAA statistics, the Sun produced 1 X-class and 18 M-class flares during the week of 5-11 February. The graph underneath shows the GOES measurements in x-rays. The red arrows indicate the cherry-picked 8 events for which imagery has been made. Indeed, there were quite a few flaring events worthwhile to just take a look at it.
The first 2 clips concern the M4.2 flare in NOAA 3575 on 6 February, and limb activity associated with the M1.2 flare in NOAA 3564 on 8 February. This active region is located about 20 degrees closer to the solar equator than NOAA 3575. The images were taken with the SDO/AIA 304 filter, showing the solar atmosphere at temperatures around 80.000 degrees.
 |
 |
Then follow clips combining SDO/AIA 171 and 131 filters, showing the solar corona at temperatures of resp. 700.000 and multi-million degrees. In the clips they are shown with resp. yellowish and blue colours. Most prominent here are the series of fine post-eruption coronal loops and the hot plasma present above these loops. All 3 eruptions took place in NOAA 3575 and concern the M5.1 flare on 7 February, the M3.9 flare that peaked early on 9 February, and of course the strong X3 flare later that day as discussed in this newsflash.
 |
 |
Last but not least follow (almost) full disk images from solar activity that took place on 10 February. The images were made with the SUVI camera on board GOES (Solar Ultraviolet Imager), combining again filters that show the Sun at multi-million degrees (SUVI 094 ; bluish hue) and at 1.25 million degrees (SUVI 195; brownish). The latter shows very well coronal dimming, i.e. a darkening in areas of the solar atmosphere consistent with material being ejected into space. These dimmings can be seen to resp. the south and north of active region NOAA 3576 (near disk centre) and were associated with a C8.1 and M9.0 flare that peaked at 07:46 and 23:07 UTC. The first of the 3 eruptions in the imagery shows a spectacular long-duration M3.4 flare near the Sun's east limb (left), that peaked at 03:54UTC.

The 8 events discussed above all had an associated coronal mass ejection (CME). Most of the CMEs had plane-of the-sky speeds around 1000 km/s, except the ones generated by NOAA 3564 which had speeds closer to 500 km/s and were also much narrower. A clip with coronagraphic images (SOHO / LASCO C3) for the entire week can be found underneath. Some of the CMEs shown are related to smaller, front-side eruptive events, or events having their origin on the far-side as they have no bright counterpart in the overlying AIA 094 imagery.

