Solar observers and space weather forecasters are recovering from the craziness after NOAA 13664 unleashed dozens of strong solar flares and earth-directed coronal mass ejections (CMEs) during the first half of May. They could barely keep up with sending alerts and analyzing all the events which happened in quick succession. This article provides some perspective on the space weather activity as a result of NOAA 13664's eruptiveness.
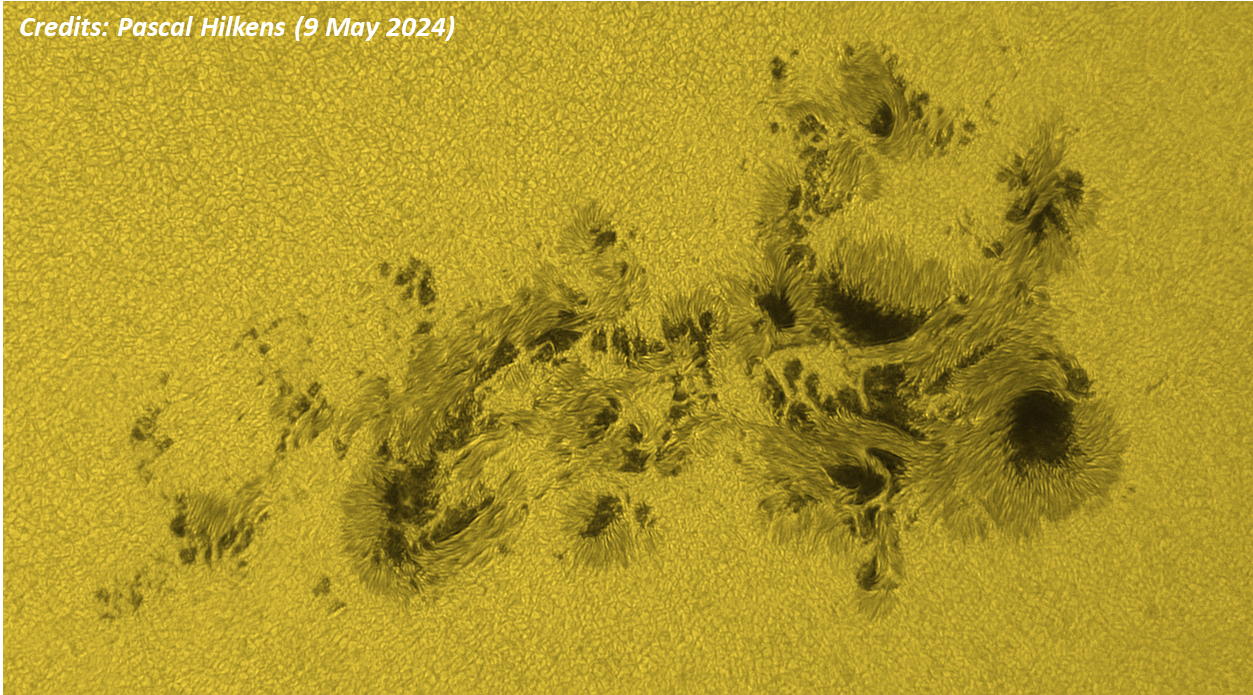
We can be very clear on NOAA 13664's flare productivity: It belongs to the highest in decades. In fact, based on the NOAA/SWPC weekly reports ((preliminary data), active region NOAA 13664 now occupies the 4th spot in terms of highest M- and X-class flare production since the start of the GOES measurements in 1976. With 65 flares, only the legendary NOAA 5395 (March 1989 - 66 M- and 14 X-class flares) and 2 groups from solar cycle 21 (SC21) are doing better. Note that all the flare intensities prior to SC25 have been upscaled by a factor 1.43 to allow comparison of the flare numbers on equal footing with the current GOES measurements (see the NOAA/SWPC note). NOAA 13664 also got the bronze medal for having produced the most X-class flares during its transit over the solar disk. With 12 "eXtreme" flares, it's just shy of NOAA 5395 (14) and NOAA 5312 (13). NOAA 13664 also produced the strongest flare so far this solar cycle (SC25), an X8.7 on 14 May (STCE newsitem). It also contributed to the very high solar activity levels observed on 8 May. This term is only given when there are at least 5 flares with an intensity of M5 or larger. This hadn't happened since 7 March 1991, and only in June 1982 there are days with even more such strong (M5 or larger) flares. Finally, May 2024 is shaping up to be one of the most flare productive ever. With still 1 week to go, it has already 102 M- and 18 X-class flares, ranking 11th in most flare productive months. March 1991 tops this list with a mind-blowing 156 M- and 23 X-class flares. Underneath a picture of NOAA 13664 taken by Pascal Hilkens on 9 May. The sunspot group is obviously the largest of the solar cycle so far (2400 MH, or 14 times the total surface of the Earth). This makes it somewhat larger than the Carrington group from 1859, but smaller than NOAA 12192 from 2014 and the Halloween group NOAA 10486 (see this STCE newsitem for more info).
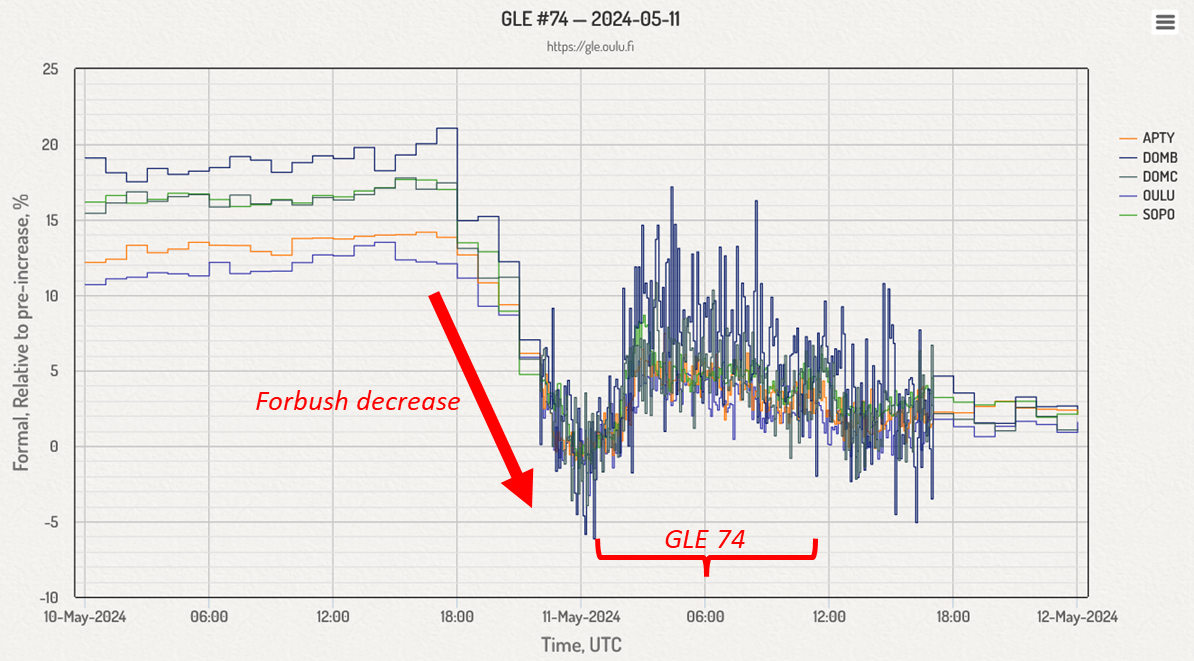
In terms of solar radiation storms, NOAA 13664 was a bit of a bummer with only 3 moderate proton events. The greater than 10 MeV proton flux reached a maximum of only 207 pfu on 10 May. However, associated with another strong X5.8 solar flare produced by NOAA 13664 early on 11 May, the greater than 100 MeV proton flux rose to 7 pfu. That was sufficient for a Ground Level Enhancement (GLE), only the second so far this solar cycle and number 74 since the measurements started back in the 1940s (Oulu). The graph underneath shows the small bump in the neutron count, which happened right during the raging geomagnetic storm of 10-11 May. The drop prior to the GLE is called a "Forbush decrease" and is the result of the passing CMEs responsible for this geomagnetic storm. They provide a strong magnetic shield against the cosmic ray particles from outside our solar system. GLE 74 will certainly not be remembered for being particularly strong. More info on GLEs in the STCE newsitems here and here.
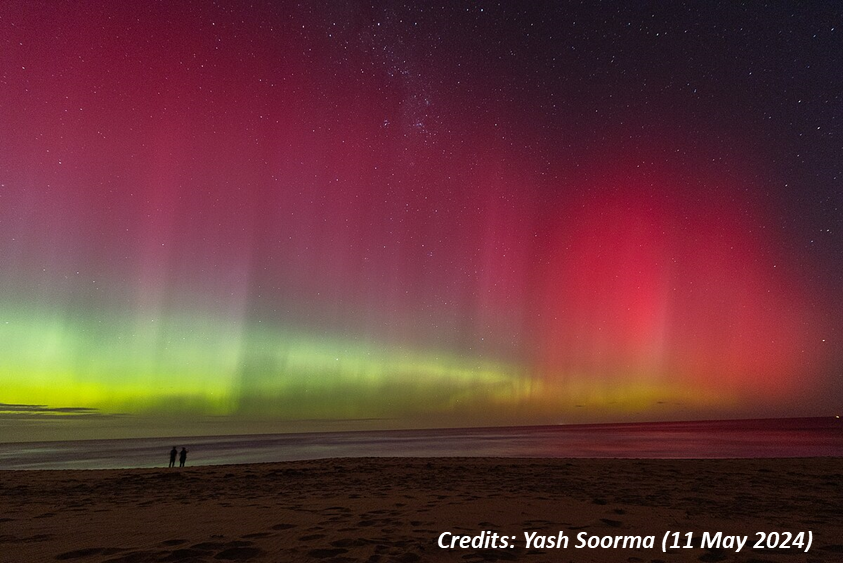
The geomagnetic storm of 10-11 May also managed to squeeze itself in a Top 10 list. Indeed, with the Disturbance storm-time index (Dst) reaching a preliminary value of -412 nT on 11 May, it is ranked as the 7th day with the most negative Dst value since the measurements started in 1957 (WDC Kyoto). It dwarfs the strongest storm of the previous solar cycle -the St-Patrick's Day storm of 17 March 2015 (-234 nT)- and we have to go back to October-November 2003 and November 2004 to find storms of comparable strength. The 10-11 May storm ranks just behind 20 November 2003 but before other major storms such as on 26 May 1967, 31 March 2001 and the Halloween storm on 30 October 2003. Only the famous 13-14 March 1989 storm (-589 nT) and 3 days in the late 1950s have a more negative Dst. That being said, as Dst values are only available since 1957, one should not forget there are also other big storms such as the Carrington event, the 4 February 1872 storm, and the 13-15 May 1921 storm. For these events, individual Dst values of resp. -949 nT, -834 nT (Hayakawa et al. 2023) and -907 nT (Love et al. 2019) have been calculated. These are clearly much stronger than the one of 10-11 May, a sobering realization! The image of the aurora underneath was taken by Yash Soorma from Melbourne (Australia) on 11 May.