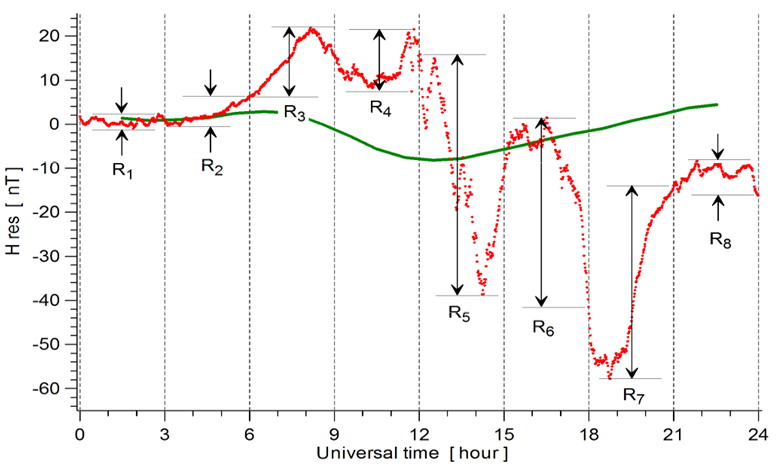
The Kp index is one of the most popular parameters to measure planetary geomagnetic activity. It is derived from local K indices evaluated at 13 subauroral observatories from both northern and southern hemispheres (ISGI map). Each K index is derived for a specific observatory from the maximum fluctuations of the horizontal components observed on a magnetogram during a 3-hour interval, evaluated as the difference between the maximum positive and negative deviations (range "R") with respect to a reference curve, which essentially reflects the local diurnal variation at the observatory (see the illustration underneath - Stankov et al. 2010). The local K index expresses geomagnetic activity on a scale of 0–9 at each observatory for a given 3-hourly interval of the UT day (00–03, 03–06, ... , 21–24 UT). K is designed to have a similar frequency distribution regardless of the observatory, and thus it does not depend on latitude (see e.g. Regi et al. 2020 for an example). K indices are converted to standardized Ks indices, which take into account the influence of seasonal and UT biases. Kp is the average of the 13 Ks indices expressed in thirds (0o, 0+, 1−, 1o, 1+, 2−, ... , 9o), thus it represents planetary, rather than local, geomagnetic activity. The complete time series of the definitive Kp index exists since 1932 and is available from the Kp website at the Deutsches GeoForschungsZentrum GFZ Potsdam. Kp is a historical parameter that is widely used in the space physics community, as it is known to be a good proxy of the solar wind energy input into the magnetosphere-ionosphere-thermosphere system.
Nonetheless, as with any parameter, the Kp index has also its drawbacks. First of all, Kp cannot resolve temporal features within 3 hours. The onset of a geomagnetic disturbance determined by Kp could be off from the actual onset by up to 3 hr. This could be an issue if Kp is used in a geospace model, because the state of the magnetosphere, ionosphere and thermosphere can change significantly within the 3-hour interval. Also, such a time interval is much larger than the characteristic times of many localized ionospheric phenomena that are of particular interest to many users. A workaround is to provide more regular updates of the K index, as is done with the K Belgium index (K Bel) which provides K values every hour, based on the disturbances observed during the previous 3 hours (Verhulst et al. 2021). The second major limitation of Kp is its upper limit at 9o. Kp is not able to quantify geomagnetic activity once it reaches 9o. Extreme geomagnetic storms involving Kp = 9o are not necessarily equally strong in terms of geomagnetic disturbance. Here, one of the workarounds is to look at other, open-ended geomagnetic parameters such as the Disturbance storm-time index (Dst), keeping in mind of course that these are different geomagnetic parameters representing different aspects of the disturbed geomagnetic field.

Enter Hpo, not to be confused with the chemical formula for water H2O, the pay television network HBO, or the Star Wars droid C-3PO. Hpo is a group of Kp-like indices, where "H" stands for half-hourly or hourly, "p" for planetary, and "o" for open-ended. Developed by researchers at GFZ under the EU Horizon 2020 project, this fairly recent geomagnetic index is designed to represent planetary geomagnetic activity in a similar manner as Kp but with a higher time resolution and without an upper limit, to overcome the aforementioned limitations of Kp. It comes in 2 varieties depending the time interval it is based on: Hp30 concerns a 30 minutes time interval, and Hp60 a 60 minutes time interval. Hpo uses the same 1-min data from the same 13 subauroral observatories as the Kp, and has a similar but not identical philosophy in deriving the Hp30 and Hp60 values (for details, see Yamazaki et al. 2022). Just as Kp, they are also expressed in thirds, but continue after 9o, e.g. 9+, 10-, 10o, 10+,... with no limit at all. The data are already available on the dedicated GFZ Potsdam website (near-real time), and have just recently been extended back to 1985 (version V3.0: Yamazaki et al. 2024 (preprint)). The Hp30 and Hp60 values have been calculated for the recent 10-12 May geomagnetic storm and arrive at respective maximum values of 11+ and 11- This is shown in the above plot, which also includes the Kp index for comparison purposes. This brings the May 2024 storm into the Top 5 of strongest geomagnetic storms of the last 40 years, with the 13-14 March 1989 storm of course taking the top spot with a maximum for Hp30 and Hp60 of respectively 13+ and 13-.
It is now waiting for the results of the calculation of the Hpo indices for great historical storms such as in in September 1859, May 1921 or March 1946. Indeed, as written in the Yamazaki et al. (2024) preprint, though the minimum Dst value is known for these storms, it may not accurately predict the magnitude of geomagnetic activity as measured by Hpo which aligns more closely with Kp as well as the solar wind coupling functions. Thus, though estimating Hpo for historical storms might not be a simple task, the obtained values could sketch a more complete picture of what happened in geospace during these important, individual events.