
The STCE's SC25 Tracking page has been updated to reflect the latest evolution of some critical space weather parameters for the ongoing solar cycle 25 (SC25). It covers various aspects of space weather, from sunspot numbers over geomagnetic indices all the way to cosmic rays. The multiple graphs allow for a comparison with previous solar cycles at similar stages in their evolution.
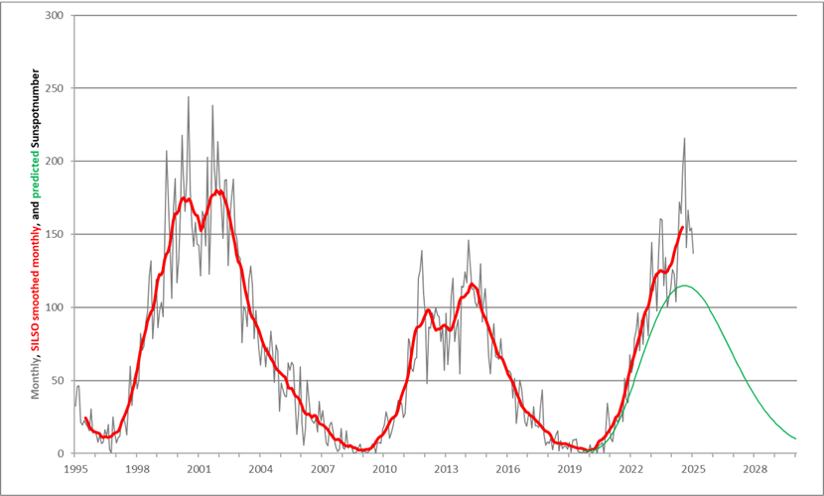
The graph below shows the monthly and SILSO smoothed monthly sunspot number (SIDC/SILSO) from around the start of SC23 up to the current SC25. The prediction for the ongoing solar cycle 25 which started in December 2019, is displayed in green. Following high solar activity during the first half of 2023, and even higher solar activity from April 2024 onwards, the smoothed monthly sunspot number can be seen rising to its maximum, with the SILSO predictions for SC25 maximum (12-month window) converging to a maximum between 154 and 171 that would take place during the September-October 2024 timeframe. Thus, SC25 maximum would be well above the initial prediction by the SC25 Panel (115), but also -for the moment- well below the moderately strong SC23 (180.3).
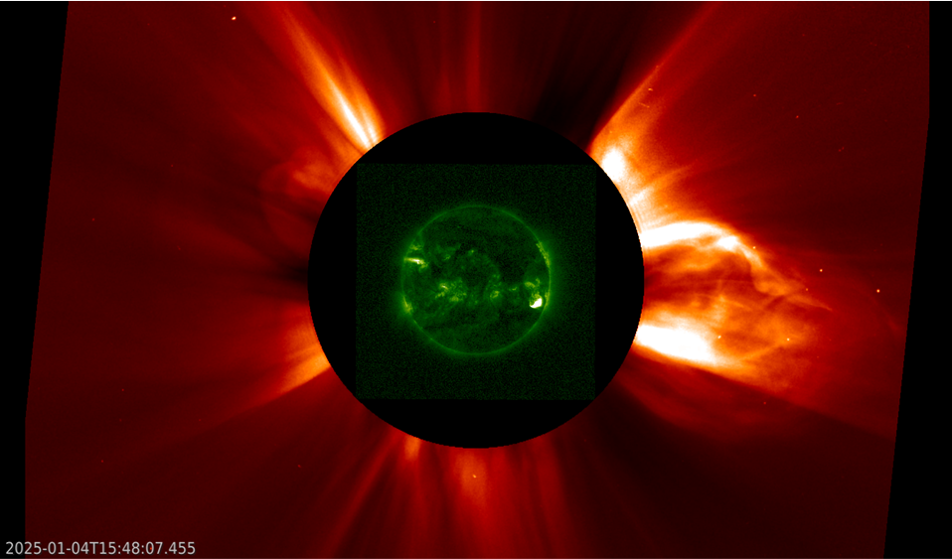
Many other parameters such as the 10.7cm radio flux, solar flaring and cosmic rays have reached values similar to SC23 or SC22, i.e. values not seen in 20 or more years. For example, the number of M- and X-class flares recorded in 2024 was at a staggering 922, which is the highest in more than 30 years. An illustration can be found underneath, when on 3 and 4 January 2025, there were no less than 3 X-class flares, as well as an M5 and an M7 event. These strong flares were all produced by NOAA 13947, located in the northeast ("upper left") solar quadrant shown in the GOES/SUVI extreme ultraviolet imagery underneath. The associated coronal mass ejections (CMEs) were not too impressive, in contrast to the much more potent CMEs (image) that had their source mostly from C-class flaring activity in NOAA 13939, located in the southwest ("lower right") solar quadrant. The CMEs can be seen in the SOHO/LASCO C2 overlay.

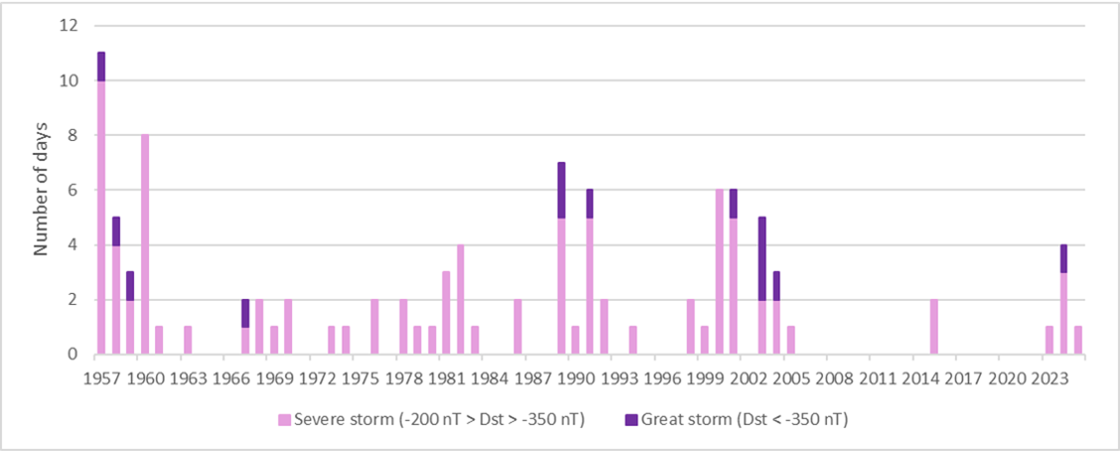
Most of these CMEs were not directed to Earth or only delivered a glancing blow, keeping the geomagnetic activity at bay. As such, the two strongest storms in SC25 so far remain the extremely severe storm of 10-11 May (Dst = -406 nT) and the severe storm of 10-11 October 2024 (Dst = -333 nT). They produced colourful polar light visible from relatively low latitudes, and impacted mainly radio communications (HF), GNSS applications and satellite atmospheric drag. The graph below shows days with strong/severe and great geomagnetic storms in terms of Dst since the start of the measurements in 1957, represented by respectively the pink and purple bars. (see also Dst terminology) The drought in strong geomagnetic activity from 2005 till 2023 is eye-catching.
