We are still in the declining phase of the solar cycle as can be seen in different physical quantities, like the 10cm flux. However, a really big sunspot group is pushing up the present 10cm flux-curve.
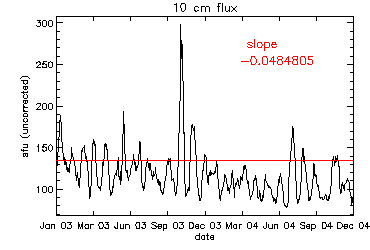
Since the peak in solar activity in the year 2000 (a second smaller peak occurred in 2002), we are on the road to the solar minimum somewhere in 2006. This trend can be seen in the two year graph of the 10 cm flux above. The 10 cm flux is the total radiation of the Sun with that particular wavelength measured here on Earth. This quantity gives an indication of the activity status of the Sun. (see the solar highlight "The day the Sun had no spots") The red straight line on the graph is the linear fit through the black capricious curve: the red curve is the best approximation by a straight line. The slope (red number) is negative, this means that the line is decreasing as it should in the decreasing phase.
Over a smaller time period, the 10cm flux can go in the other direction. This can be seen in the black curve. The fluctuating tendency matches the monthly rotation of the Sun around her own spinning axis. Since January 10, 2005, we see a spectacular jump upwards in the 10cm flux mainly due to the appearance and growth of Catania sunspot group number 05 (NOAA 0720). The MDI-link contains a movie showing the magnetic configuration of this group (the black-white area in the northern hemisphere, as can be seen in the picture underneath).